Unlocking Market Geometry: The Power of Fibo Retracement
In the world of technical analysis, few tools carry as much weight and historical significance as the Fibo Retracement. Based on the mathematical sequences discovered by Leonardo Fibonacci, this tool is not just a collection of lines on a chart; it is a map of human psychology and market rhythm. For traders navigating the complex waters of the Forex market, understanding these "golden ratios" is often the difference between a failed entry and a precision trade.
The Science Behind the Ratios
The Fibo Retracement tool works on the principle that after a significant price movement—either up or down—the market will often "retrace" a portion of that move before continuing in the original direction. These pullback levels typically align with specific percentages derived from the Fibonacci sequence: 23.6%, 38.2%, 50%, and 61.8%.
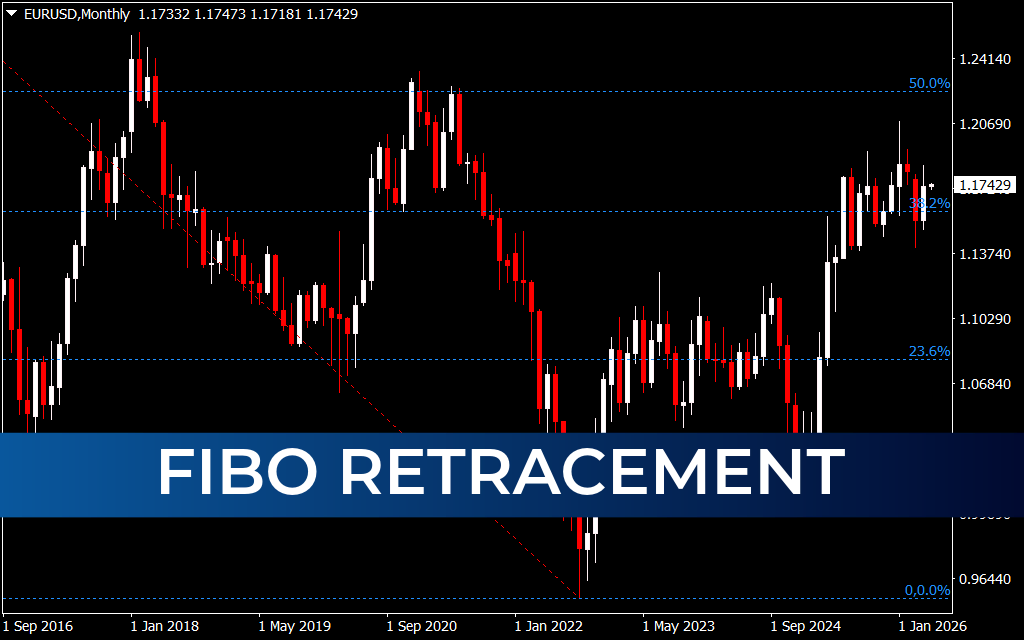
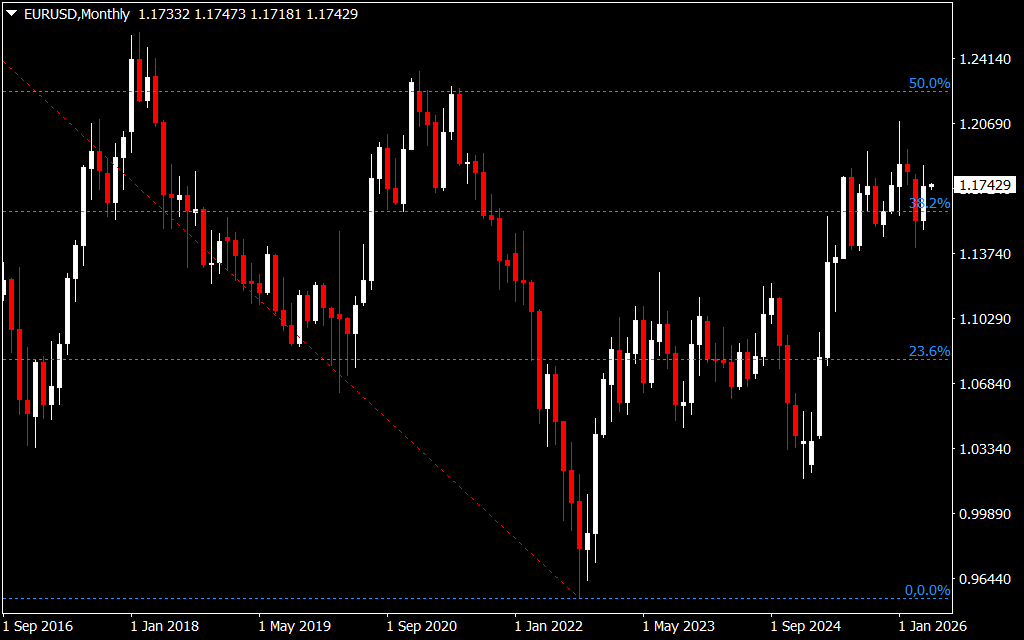
As seen in the provided EUR/USD Monthly chart, the Fibo Retracement tool has been applied to a massive multi-year downward swing. Notice how the Price Action interacts with the horizontal blue dotted lines. Currently, the market is hovering around the 38.2% level, which acts as a major structural pivot point. When price stalls at these levels, it signals to traders that the "smart money" is watching these exact coordinates to re-enter positions.
Why Fibo Retracement is Essential
- Predictive Support And Resistance: Unlike traditional horizontal lines that rely on past peaks, Fibonacci levels can predict where future support or resistance might form before the price even gets there.
- Objective Entry Zones: It removes the emotional guesswork. Instead of wondering if a dip is "deep enough" to buy, a trader can wait for a touch of the 50% or 61.8% level to execute their plan.
- Confluence Building: The strongest signals occur when a Fibonacci level aligns with other indicators, such as a moving average or a historical supply zone.
- Universal Applicability: While the Monthly chart shows the "big picture," the same ratios apply to 5-minute charts for scalpers, proving the fractal nature of the markets.
Strategic Implementation
To use the Fibo Retracement effectively, you must identify a clear "swing high" and "swing low." In a bearish trend, you draw from the peak to the trough. The resulting levels provide a roadmap for the relief rally. If the price fails to break above the 61.8% "Golden Ratio", it is a strong technical signal that the primary downtrend remains intact.
For modern traders, having an automated or high-precision Fibo tool for MT4 is a game-changer. It ensures that your anchors are mathematically correct, allowing you to focus on the most important aspect of trading: execution and risk management.
5 Downloads
Last Update:
May 01, 2026 15:25 PM
Published:
Jan 29, 2026 18:26 PM
Category: