Identify Market Turns with the Extremum Indicator
In the world of professional trading, the ability to distinguish between a healthy Trend Continuation and an exhausted market is what separates the veterans from the novices. Many traders struggle with "buying the top" or "selling the bottom" because they lack a clear visual representation of market momentum and exhaustion. The Extremum Indicator is a powerful oscillator designed specifically to solve this problem by identifying price extremes and potential reversal points before they occur.
Understanding the Extremum Oscillator
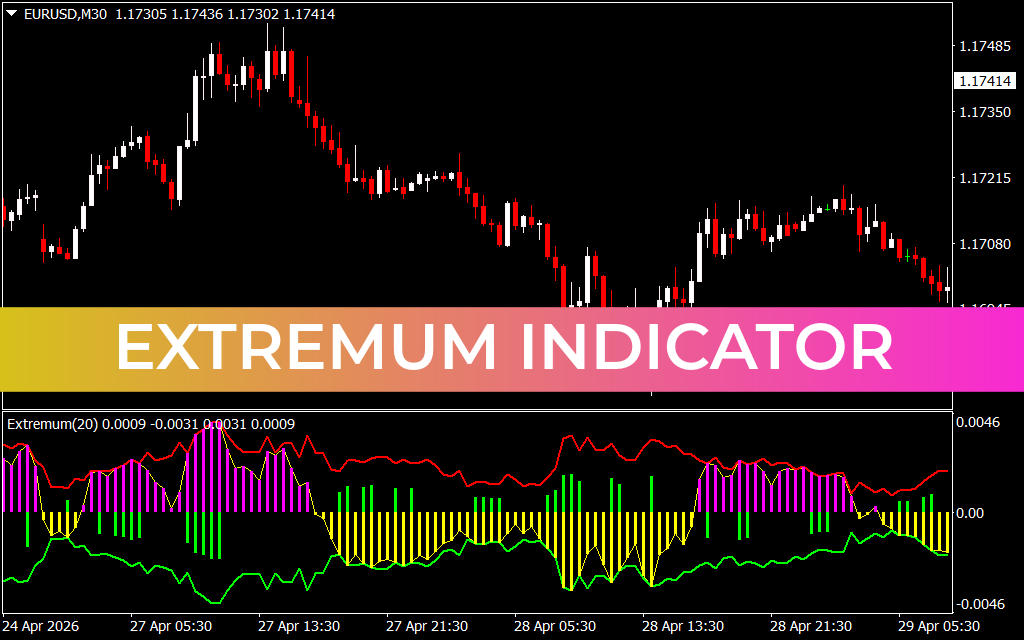
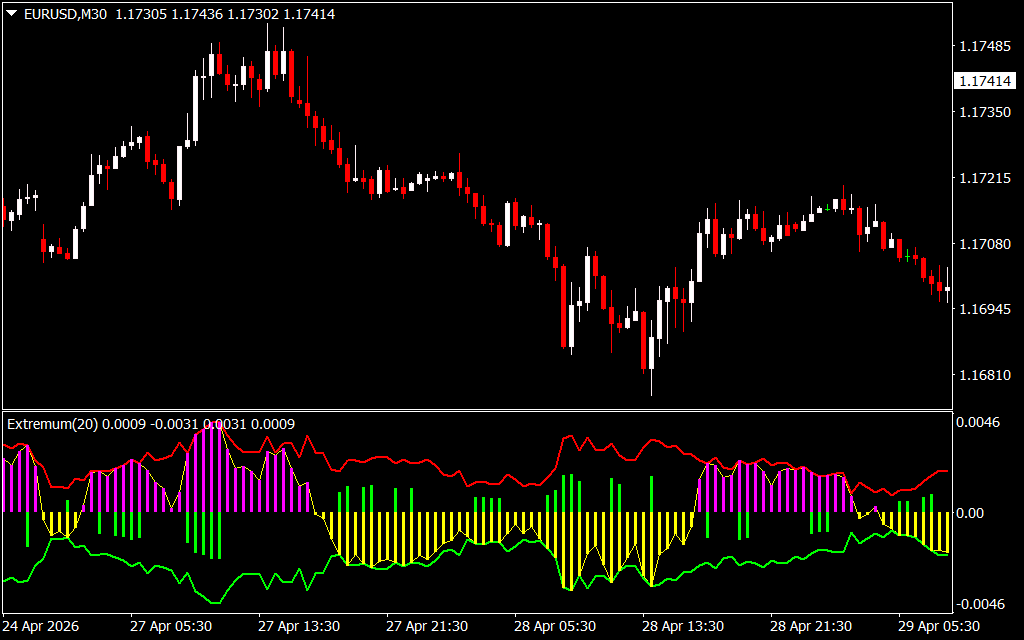
The Extremum Indicator operates in a separate sub-window, providing a multi-dimensional view of Price Action. As shown in the EUR/USD M30 chart, it combines a histogram with signal lines to map out the market's internal strength. Unlike traditional oscillators like the RSI or Stochastic, which can stay overbought or oversold for extended periods during a trend, the Extremum Indicator focuses on the statistical likelihood of a price reversal.
The color-coded histogram (featuring purple, green, and yellow bars) allows traders to quickly assess the current state of momentum. When the histogram reaches a peak—an "extremum"—and begins to shift color, it indicates that the current buying or selling pressure is fading, providing an early warning signal for swing traders.
Key Benefits of the Extremum Indicator
- Divergence Detection: One of the most powerful uses of the Extremum tool is identifying divergences. If price makes a new high but the Extremum histogram makes a lower high, a Trend Reversal is often imminent.
- Noise Filtration: By focusing on specific cycles, the indicator ignores minor price "hiccups" and only alerts the trader when a significant market extreme has been reached.
- Visual Clarity: The distinct color shifts in the sub-window make it an ideal "confirmation" tool. If you have a price action signal on your main chart, the Extremum provides the necessary mechanical data to pull the trigger.
- Versatility: While the M30 timeframe is a "sweet spot" for many intraday traders, the Extremum works efficiently across all major currency pairs and indices, adapting to different levels of volatility.
How to Trade with the Extremum
The most effective strategy involves looking for confluence between price action and the Extremum levels. In the provided chart, notice how the peaks in the purple histogram bars align with the short-term tops in the EUR/USD price. As the histogram retracts toward the zero line, it signals that the momentum has shifted.
Traders often use the Extremum to manage their exits. If you are in a profitable long position and the Extremum hits a historical peak in the upper boundary, it may be the perfect time to trail your stop-loss or take partial profits. Conversely, a green histogram spike at the bottom of a range provides a high-probability entry for those looking to "buy the dip."
By adding the Extremum Indicator to your technical arsenal, you gain a mathematical edge that helps you stay calm during volatile sessions. It transforms subjective market analysis into an objective, data-driven trading process.
5 Downloads
Last Update:
May 01, 2026 15:30 PM
Published:
Jan 29, 2026 18:19 PM
Category: