Predictive Analysis with the Extrapolated Previous Trend Indicator
In the dynamic environment of Forex trading, understanding where the price has been is the only way to project where it might go. Most traders struggle with subjective trendlines that change every time they look at the chart. The Extrapolated Previous Trend Indicator for MT4 removes this guesswork by using mathematical linear regression and historical price data to project current trend trajectories into the future.
The Science of Trend Extrapolation
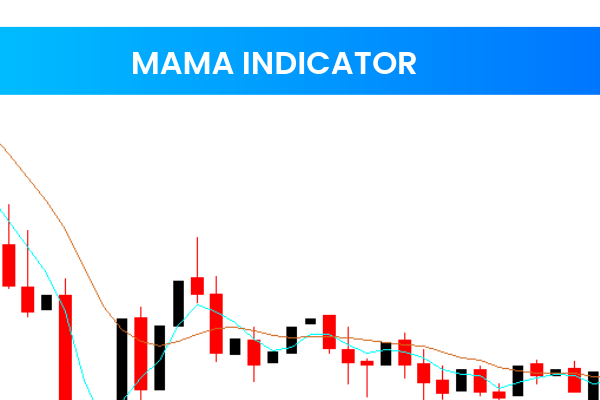
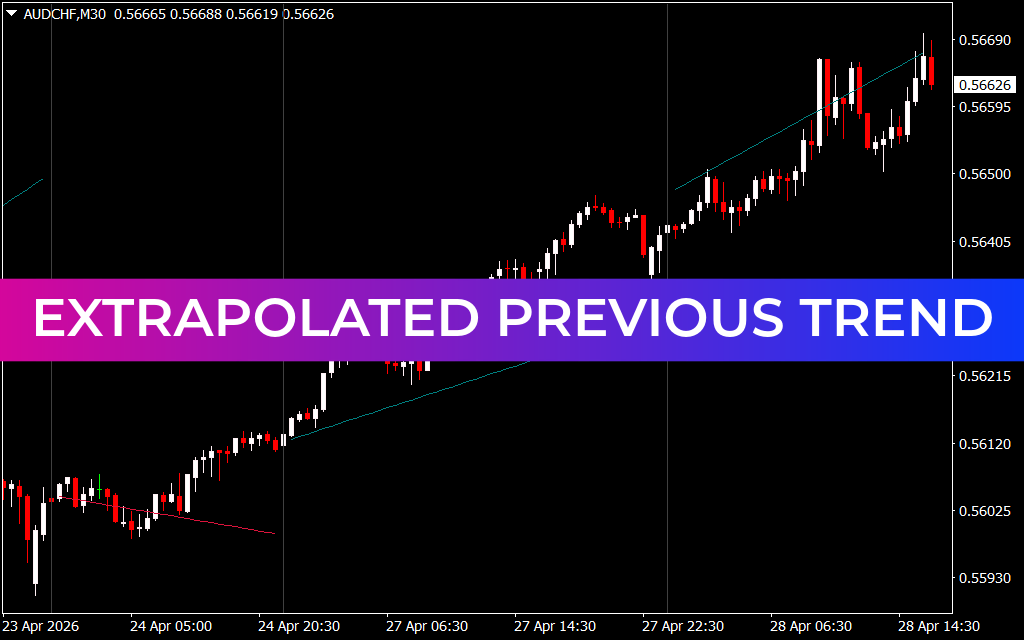
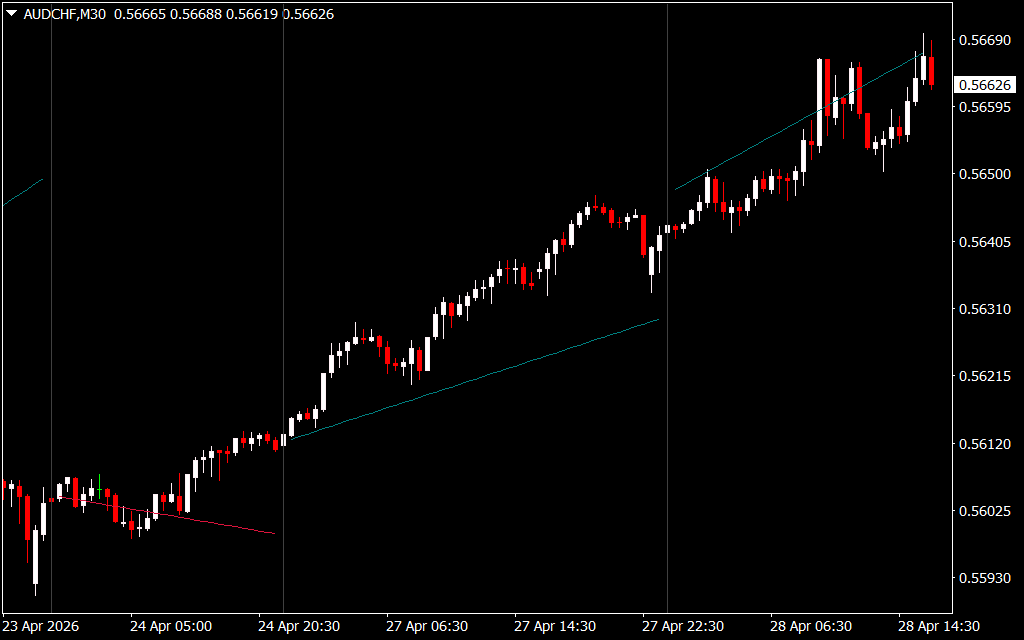
Extrapolation is the process of estimating beyond the original observation range based on an established relationship. In trading, this means taking a confirmed trend from a previous session or period and extending that slope into the current Price Action. As seen in the AUD/CHF M30 chart, the indicator draws precise, angled lines (cyan for bullish, red for bearish) that represent the "momentum memory" of the market.
These lines serve as a benchmark. When the price stays above an extrapolated bullish line, the trend is considered healthy and accelerating. When the price crosses these lines, it signals a "break of character," suggesting that the previous trend’s strength is waning and a reversal or consolidation phase is imminent.
Key Features and Trading Benefits
The Extrapolated Previous Trend Indicator is particularly effective for swing traders and intraday trend followers. Its primary benefits include:
- Objective Support And Resistance: Unlike static horizontal levels, these extrapolated lines move with the market’s diagonal momentum, providing dynamic support and resistance levels that adapt to volatility.
- Session Break Identification: The indicator automatically adjusts its calculations based on period separators (vertical lines on the chart), helping traders see how the momentum from the Tokyo or London session is influencing the New York open.
- Visual Clarity on Higher Timeframes: On the M30 timeframe, noise is filtered out. The indicator highlights the dominant slope, allowing traders to remain patient and stay in winning trades longer by providing a visual "floor" or "ceiling."
Strategic Implementation
To trade effectively with this tool, look for confluence. If the price retraces to touch an extrapolated cyan line and bounces with a bullish pin bar or engulfing candle, it confirms that the market is still respecting the previous momentum. This offers a high-probability entry point with a clearly defined stop-loss level just below the line.
Furthermore, the indicator helps in identifying "Over-extension." If the price moves too far away from the extrapolated trendline, it is often a signal that the market is overbought or oversold, and a move back toward the mean is likely. By combining the Extrapolated Previous Trend Indicator with your existing oscillators or volume tools, you create a robust strategy that accounts for both price history and future potential.
3 Downloads
Last Update:
Apr 28, 2026 19:44 PM
Published:
Jan 31, 2026 19:34 PM
Category: