Elevate Your Strategy: Precision Trading with EMA Bands
In the volatile landscape of modern financial markets, traders are constantly searching for a balance between trend-following and mean reversion. While standard moving averages offer a glimpse into the market's direction, they often fail to capture the boundaries of Price Action. This is where EMA Bands (Exponential Moving Average Bands) become an essential component of a professional trading toolkit, providing a dynamic roadmap for price fluctuations.
Understanding the EMA Bands Framework
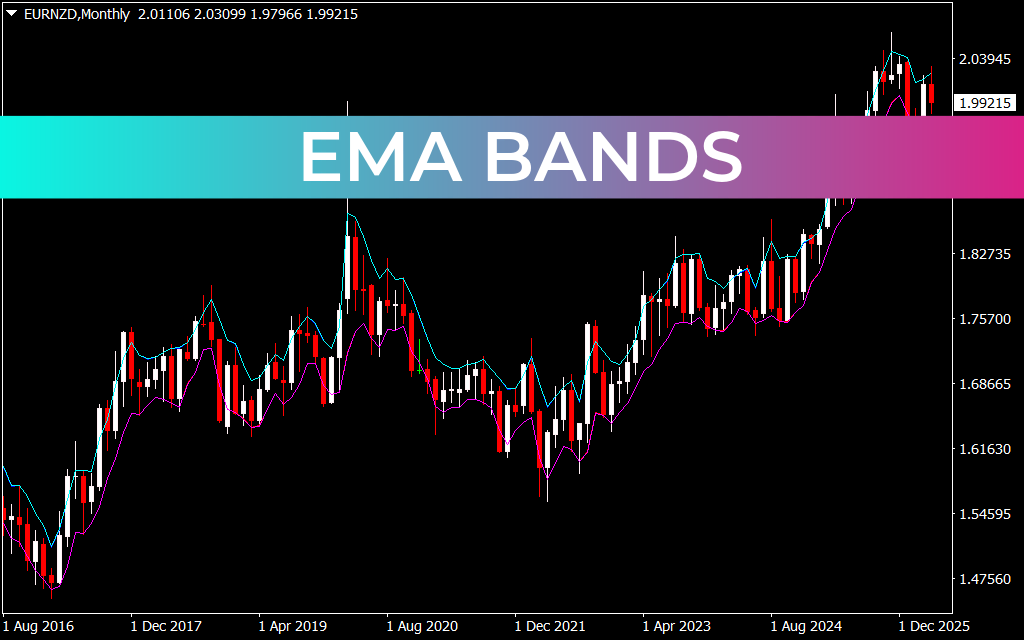
EMA Bands are a volatility-based technical indicator that plots multiple lines around a central exponential moving average. Unlike simple moving averages, the "exponential" nature of these bands means they place greater weight on the most recent price data. This makes the indicator highly responsive to sudden market shifts, allowing traders to react faster than those relying on lagging, traditional overlays.
The bands create a visual corridor. The central line represents the fair value or "mean" of the asset, while the outer bands represent levels of statistical deviation. When price pushes toward the outer limits, it signals that the market is reaching an overbought or oversold state relative to its current trend.
Key Trading Advantages
The EMA Bands indicator excels in three primary areas of market analysis:
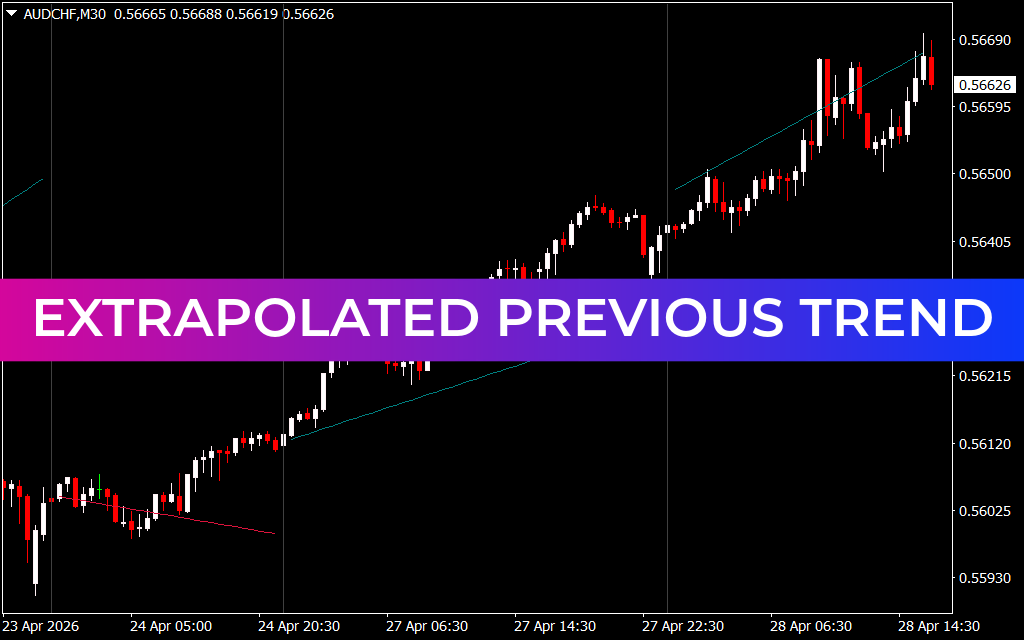
- Trend Identification: When the bands are sloping upward and price consistently holds above the center line, a strong bullish trend is confirmed. Conversely, a downward slope with price hugging the lower bands indicates a sustained bearish environment.
- Volatility Visualization: The width of the bands adjusts based on market movement. Narrowing bands (squeezes) suggest a period of consolidation often followed by a massive breakout, while widening bands indicate high volatility and intense price swings.
- Dynamic Support And Resistance: Unlike horizontal levels that remain static, EMA Bands move with the market. The center line often acts as a "magnetic" support level in an uptrend, offering high-probability entry points for trend-following traders.
Strategic Implementation
For many traders, the EMA Bands serve as a primary filter for trade selection. A common strategy involves looking for "price rejection" at the outer bands. If a candle touches the upper band and prints a reversal pattern—such as a shooting star—it provides a signal that the move may be exhausted.
Furthermore, the EMA Bands are highly customizable. Whether you are a day trader looking for micro-trends on a 5-minute chart or a position trader analyzing weekly cycles, the period and deviation settings can be adjusted to match your specific risk profile. By integrating EMA Bands into your chart, you transition from guessing where the price might go to trading within a mathematically sound structure.
1 Download
Last Update:
Apr 26, 2026 23:37 PM
Published:
Feb 01, 2026 21:07 PM
Category: