Simplify Complex Trends with the Wcci Chart Indicator for MT4
In the fast-moving world of currency trading, the ability to identify a trend before it fully matures is a superpower. Retail traders often struggle with "analysis paralysis," looking at too many conflicting signals at once. The Wcci Chart Indicator for MetaTrader 4 is engineered to streamline this process, providing a high-definition view of market momentum through the lens of the world-renowned Woodies Commodity Channel Index (CCI) methodology.
The Logic of the Woodies System
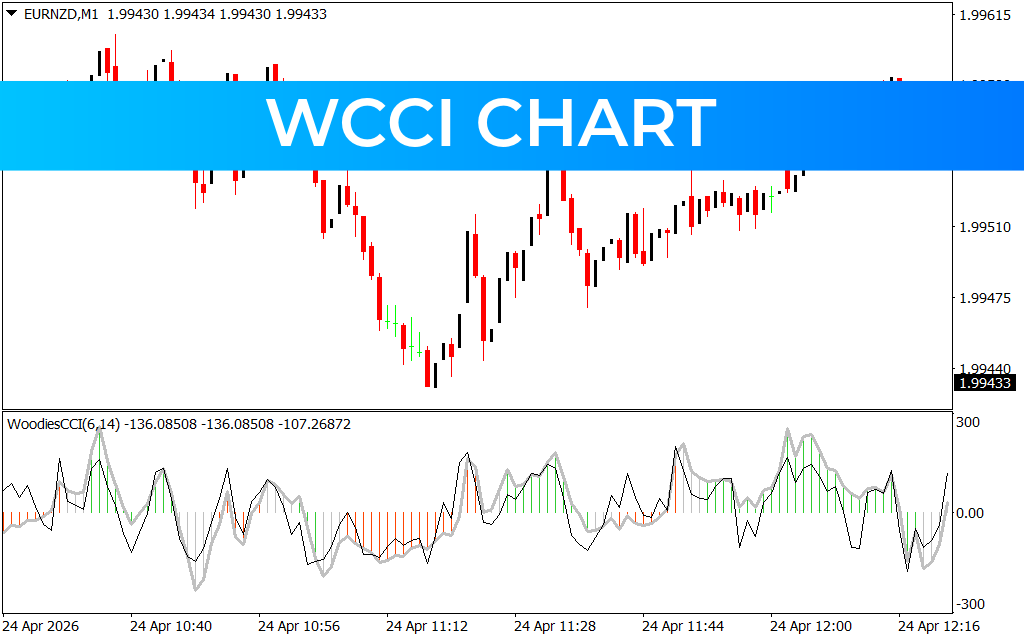
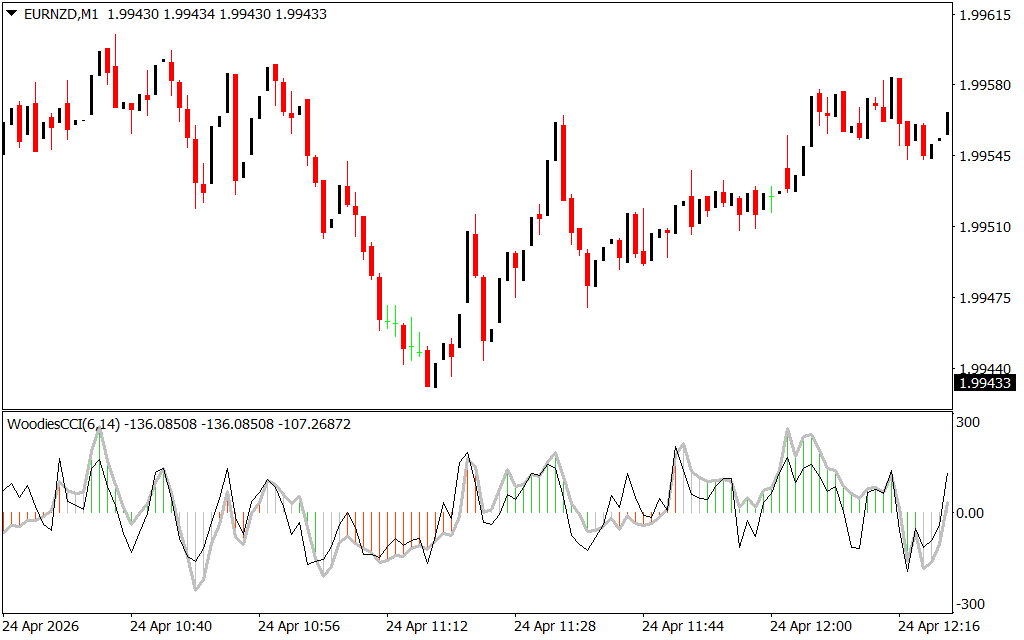
The Wcci Chart is more than just a basic oscillator; it is a complete trading system condensed into a single sub-window. The indicator calculates the relationship between the current price and its average over a specific period, typically using a 6 and 14-period setting for maximum responsiveness. As seen in the recent EURNZD M1 Price Action, this dual-period approach allows the indicator to capture both the immediate "fast" momentum and the broader "slow" trend.
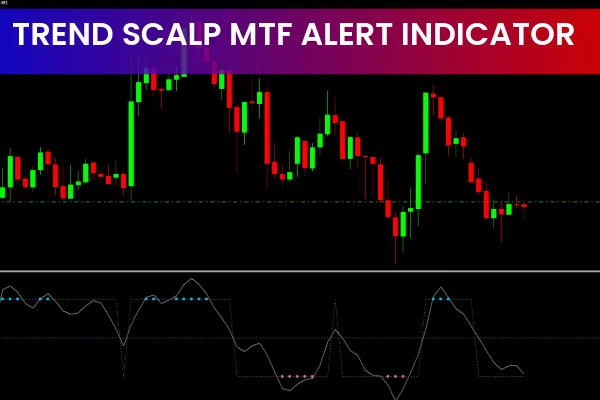
The visual interface is designed for split-second decision-making. By utilizing a zero-line histogram, the Wcci Chart identifies the "Trend Agreement" phase. When the price stays above the zero line for several consecutive bars, it establishes a bullish trend. Conversely, consistent trading below the zero line confirms a bearish bias. This helps scalpers avoid the common trap of trading against the dominant institutional flow.
Navigating Volatility on the M1 Timeframe
Scalping pairs like EURNZD requires extreme precision. On April 24, 2026, the market experienced a sharp dip toward the 1.99440 support level. While a standard chart might have looked chaotic, the Wcci Chart provided clear visual cues:
- Overextended Extremes: The indicator plotted sharp "V" shapes near the -300 level, signaling that the sell-off was mathematically exhausted.
- Histogram Color Shifts: Notice the transition from red bars to green bars. This color-coding acts as a real-time filter, highlighting when the bulls have successfully rejected lower prices.
- The Zero-Line Reject: One of the most powerful setups in the Woodies system, where the price pulls back toward the zero line but bounces off it, confirming that the original trend is still intact.
Why Every Intraday Trader Needs Wcci Chart
The primary strength of the Wcci Chart Indicator is its focus on price velocity. It ignores the "noise" of small wicks and erratic candles, focusing instead on whether momentum is accelerating or decelerating. This clarity allows traders to manage their emotions, stay in winning trades longer, and cut losing trades the moment momentum shifts against them.
Whether you are a seasoned pro-trader or a beginner exploring the MetaTrader 4 platform, the Wcci Chart provides a professional edge. Its intuitive histogram and signal line combination offer a clean, data-driven alternative to cluttered charts. Upgrade your technical analysis today and start seeing the market through the eyes of momentum.
1 Download
Last Update:
Apr 24, 2026 18:08 PM
Published:
Feb 03, 2026 02:00 AM
Category: