Navigating Market Volatility with the Donchian Fibonacci Indicator
In the competitive landscape of Forex trading, identifying precise Support And Resistance levels is the cornerstone of a successful strategy. While many traders rely on static levels, the most profitable professionals use dynamic tools that adapt to shifting market conditions. The Donchian Fibonacci indicator is a sophisticated hybrid tool that combines the structural power of Donchian Channels with the mathematical precision of Fibonacci retracement levels, providing a comprehensive map of Price Action.
The Synergy of Structure and Mathematics
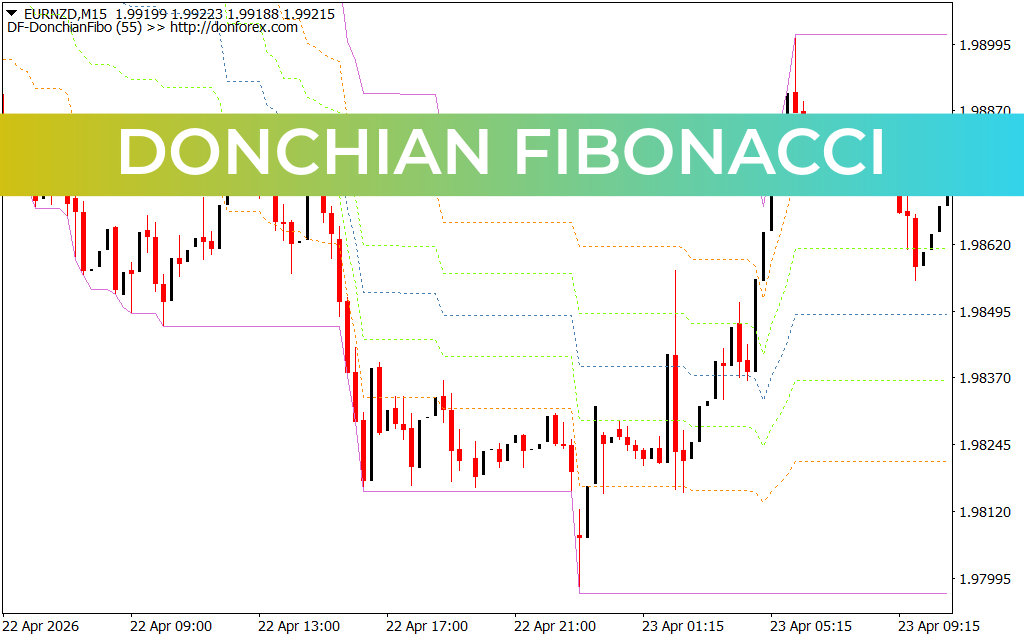
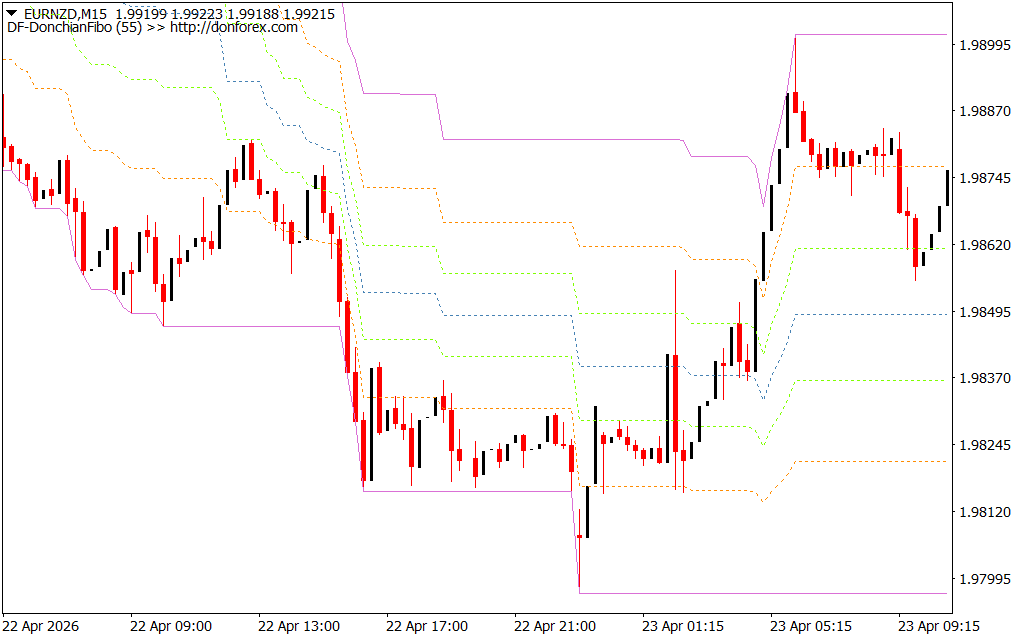
The Donchian Fibonacci indicator operates by identifying the highest high and the lowest low over a specific period—the core mechanic of a Donchian Channel. However, it takes this analysis further by automatically plotting Fibonacci ratios (such as 23.6%, 38.2%, 50%, and 61.8%) within that price range. This creates a multi-layered grid that highlights potential "hidden" turning points within a broader trend.
As evidenced in the EURNZD M15 and H1 chart analyses, this indicator provides a clear visual hierarchy:
- Outer Boundaries (Donchian Lines): The solid top and bottom lines represent the current price "ceiling" and "floor." A breakout beyond these levels often signals the start of a massive new trend.
- Internal Fibonacci Levels: The dashed lines between the boundaries act as minor support and resistance. These are critical for traders looking to "buy the dip" or "sell the rally" within an established range.
Why Every MetaTrader User Needs This Tool
The primary challenge with manual Fibonacci plotting is subjectivity—two traders may pick different swing highs and lows, leading to conflicting levels. The Donchian Fibonacci indicator eliminates this human error by automating the process based on objective price data.
Key benefits include:
- Volatility Adaptation: Because the grid expands and contracts based on market range, it stays relevant during both quiet consolidation and high-impact news events.
- Precise Entry and Exit Points: Scalpers using the M15 timeframe can use the Fibonacci levels to set tight stop-losses and realistic take-profit targets.
- Trend Confirmation: When price holds above the 50% (median) line, the market bias remains bullish. A break below this level is often the first warning sign of a Trend Reversal.
Strategic Implementation
The most effective way to deploy the Donchian Fibonacci indicator is as a Structural Filter. By aligning these levels with other technical signals—such as the Pro4X Pivot Lines or momentum oscillators—you can identify "Confluence Zones." A trade setup that occurs where a Fibonacci level overlaps with a Weekly Pivot is a high-probability opportunity that institutional traders often watch.
Whether you are a day trader navigating the intraday noise or a swing trader looking for the next big move on the Weekly charts, the Donchian Fibonacci indicator provides the mathematical edge required to stay ahead of the curve.
19 Downloads
Last Update:
Apr 26, 2026 23:07 PM
Published:
Feb 01, 2026 21:42 PM
Category: