The Dolly Graphics v11 GMT Shift Indicator for MT4 is a pivot-based trading tool that provides traders with valuable insights into potential buy and sell zones. This indicator automatically calculates pivot points—key price levels derived from the previous day’s high, low, and close. These pivot points act as dynamic support and resistance levels, guiding traders to make more informed trading decisions.
In addition to its pivot calculations, the Dolly Graphics v11 also displays crucial market data, including the daily open, daily range, and GMT time shift, making it an all-in-one indicator for day and swing traders.
How the Dolly Graphics v11 GMT Shift Indicator Works
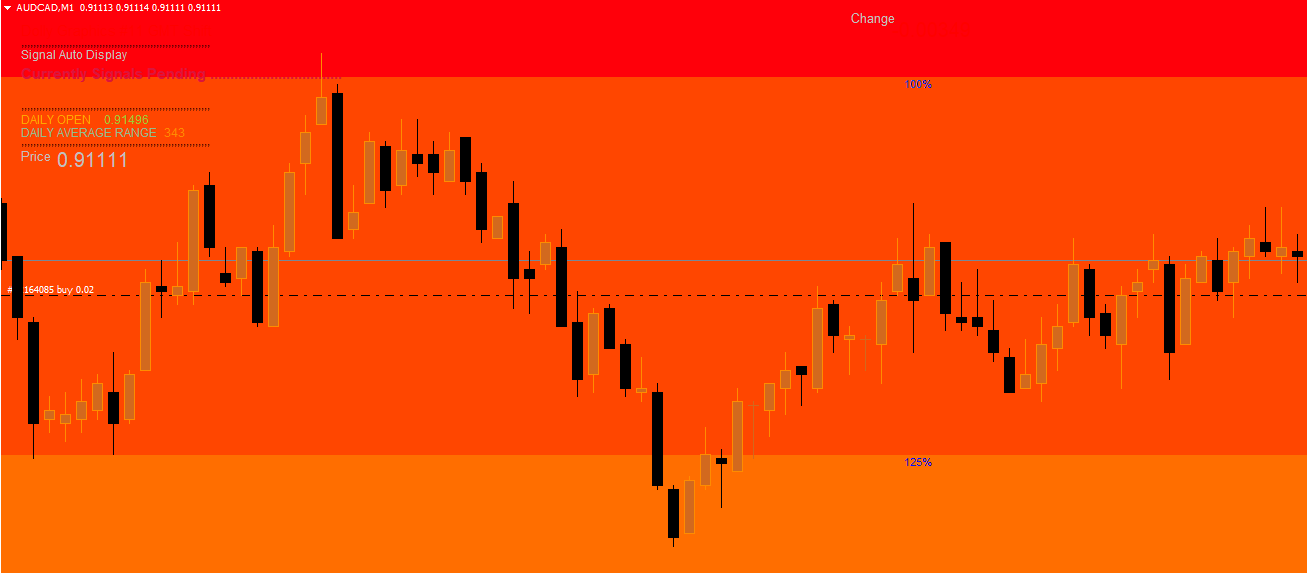
The Dolly Graphics indicator uses a color-coded visual system to help traders quickly recognize bullish and bearish market conditions.
Blue or Dark Blue Zone: Indicates a buy signal. This means Price Action is trading above key pivot levels, suggesting upward momentum.
Red or Maroon Zone: Indicates a sell signal. This appears when price trades below pivot levels, pointing to bearish pressure.
These color changes are plotted directly on the chart, providing instant visual cues for entry and exit zones. Because the indicator automatically adapts to each trading day, traders don’t have to manually calculate or adjust pivot levels.
How to Use the Dolly Graphics v11 GMT Shift Indicator for MT4
The chart above illustrates the USD/JPY H4 timeframe with the Dolly Graphics v11 applied. Here’s how traders can use it effectively:
Identify the Trading Zone
When the indicator displays blue or dark blue, look for buy opportunities.
When it turns red or maroon, consider sell positions.
Confirm with Price Action
Although the indicator provides reliable color signals, it’s essential to confirm with candlestick patterns or trend indicators like RSI, MACD, or Moving Averages before entering trades.
Manage Risk Properly
Set stop-losses just below the blue zone for buys or above the red zone for sells. This helps minimize losses in case of false breakouts.
Avoid High-Volatility Periods
During major news events or market openings, false signals may occur. Use the indicator alongside a news filter or economic calendar to stay safe.
Why Use the Dolly Graphics Indicator?
The Dolly Graphics v11 GMT Shift Indicator stands out because it combines multiple analytical tools into one compact display. Key advantages include:
Pivot-based trading system for identifying key market levels
Color-coded zones for instant buy/sell recognition
Daily open, range, and GMT shift info included
Adaptable to any currency pair or timeframe
Beginner-friendly interface
This makes it ideal for both new traders who need simple visual signals and advanced traders who want detailed pivot analysis.
Tips for Better Results
To get the most accurate results using Dolly Graphics v11 GMT Shift:
Combine it with a trend confirmation indicator such as the ADX or Heiken Ashi.
Avoid trading against the major trend—follow the direction indicated by higher-timeframe pivots.
Always practice sound money management, risking only a small percentage of your account per trade.
Conclusion
The Dolly Graphics v11 GMT Shift Indicator for MT4 is a powerful pivot-based tool that simplifies market analysis by highlighting buy and sell zones through color-coded visual cues. It combines pivot points, daily range, and GMT shift information to provide a comprehensive view of market dynamics.
While the indicator offers strong visual guidance, it should be used in conjunction with other forms of technical analysis to filter out false signals—especially during volatile periods.
Download the Dolly Graphics v11 GMT Shift Indicator for MT4 for free from our website and start trading with greater clarity and confidence.
FAQ
2 Downloads
Published:
Nov 07, 2025 12:53 PM
Category: