Mastering the Markets with the Direction Trend Line Indicator
In the complex world of technical analysis, the most successful traders are often those who can simplify Price Action into actionable data. Among the myriad of tools available on the MetaTrader platform, the Direction Trend Line remains a fundamental asset for those seeking to capitalize on market momentum. By providing a dynamic, visual representation of the market's "path of least resistance," this indicator allows traders to stop guessing and start following the money flow with professional-grade precision.
The Psychology of Trend Following
At its core, a trend line is more than just a slanted line on a screen; it is a visual record of market sentiment. A rising Direction Trend Line indicates that buyers are willing to pay increasingly higher prices, while a falling line shows sellers are in aggressive control. The Direction Trend Line indicator automates the process of identifying these shifts, utilizing smoothed mathematical algorithms to distinguish between a genuine trend and temporary market "noise."
Key Features and Performance
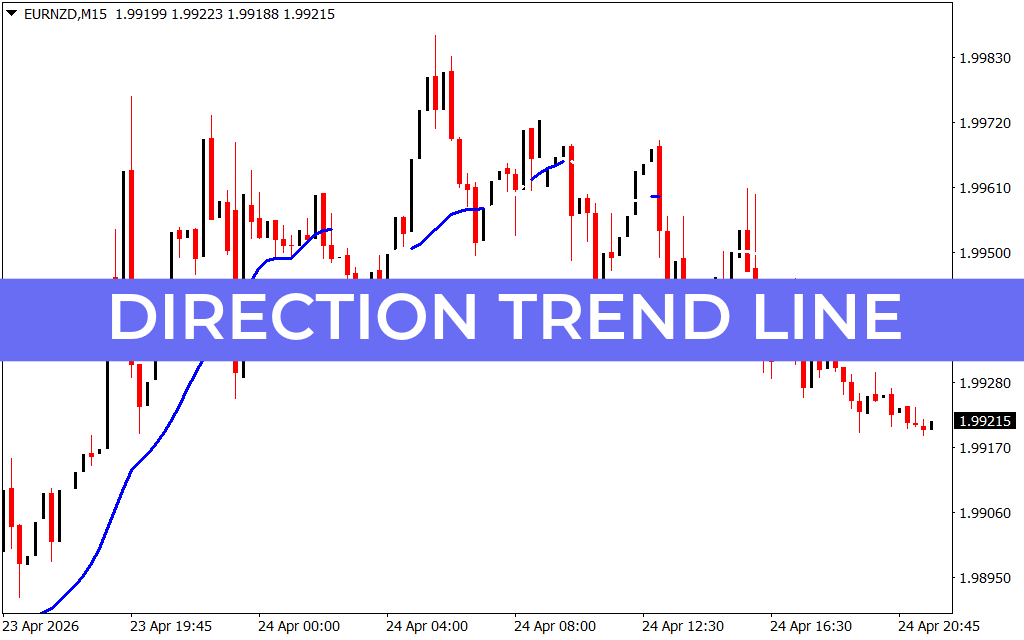
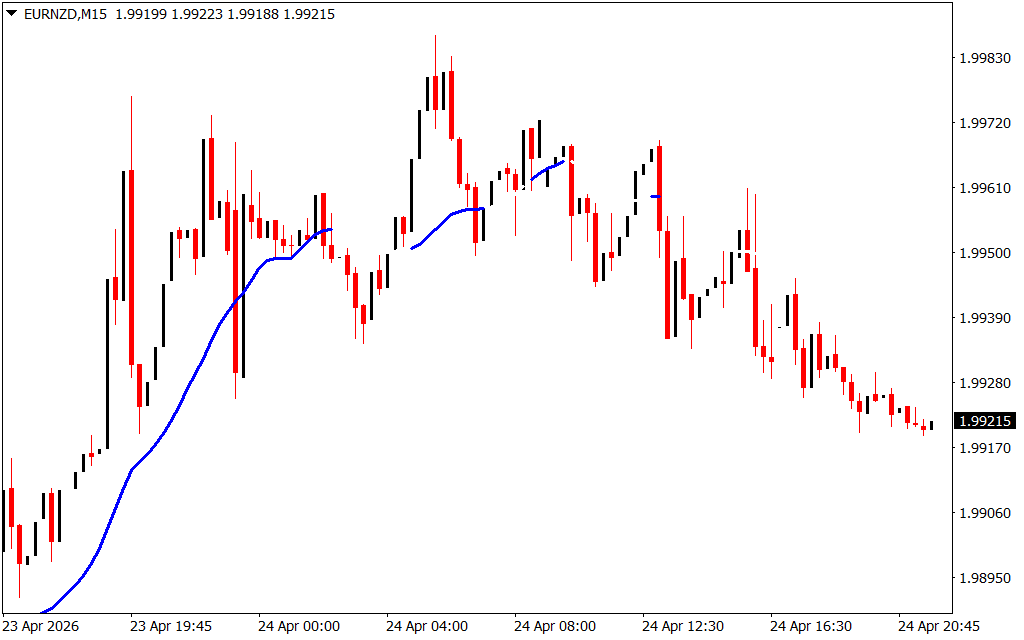
As seen in the EURNZD M15 and H1 chart analyses, the Direction Trend Line is designed for maximum clarity. It typically features a color-coded interface that changes based on the slope of the price action:
- Bullish Phase (Blue/Green): When the line is sloped upward and colored for growth, it confirms that the bulls have the upper hand. In this phase, the line acts as a dynamic support level where traders look for "buy the dip" opportunities.
- Bearish Phase (Red): When the line turns downward, it signals a shift to bearish dominance. The line then transitions into a dynamic resistance barrier, identifying the optimal zones to enter short positions.
- Neutral Squeeze: When the line flattens, it warns of a ranging market or an impending breakout, signaling to the trader that it may be time to tighten stop-losses or move to the sidelines.
Multi-Timeframe (MTF) Synergy
One of the most powerful ways to utilize the Direction Trend Line is through multi-timeframe analysis. For example, a trader might look at the Weekly (W1) chart to determine the "macro" direction. If the W1 Direction Trend Line is bullish, the trader will then drop down to the M15 or H1 charts to find entry points that align with that long-term bias. This "top-down" approach significantly increases the win rate by ensuring the trader is never fighting against the broader market momentum.
Strategic Integration
The Direction Trend Line is an excellent "confluence" tool. When price touches the trend line at the same time an oscillator like the CCI or Stochastic hits an extreme level, the probability of a successful trade increases exponentially. Furthermore, because the line is "smoothed," it prevents the "sawtooth" effect that often leads to premature exits, allowing you to ride a trend to its absolute exhaustion.
Whether you are a scalper seeking quick pips on the 1-minute chart or a swing trader holding positions for weeks, the Direction Trend Line provides the structural blueprint necessary to navigate the Forex market with confidence.
1 Download
Last Update:
Apr 26, 2026 23:01 PM
Published:
Feb 01, 2026 21:53 PM
Category: