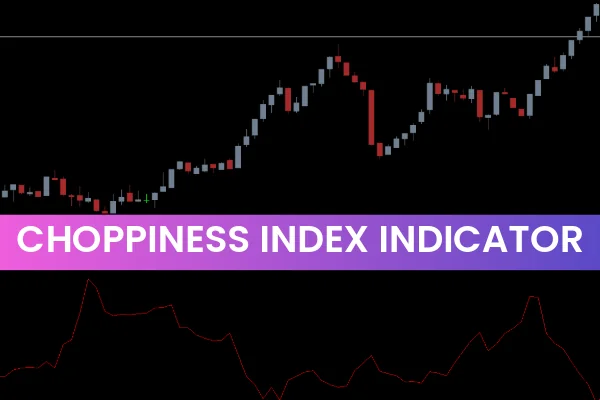
The Choppiness Index Indicator for MT4 is a powerful technical analysis tool designed to help forex traders identify whether the market is trending or moving sideways. Since the forex market rarely moves in a perfectly straight line, understanding the difference between a choppy and directional market is crucial. This indicator makes the task easier by visually displaying market conditions so traders can adapt their strategies accordingly.
The Choppiness Index is especially useful for beginners who often struggle to differentiate between sideways consolidation and strong trends. Experienced traders also benefit by using the indicator to build more advanced trading systems and avoid entering trades during unfavorable market conditions.
Understanding the Choppiness Index Indicator
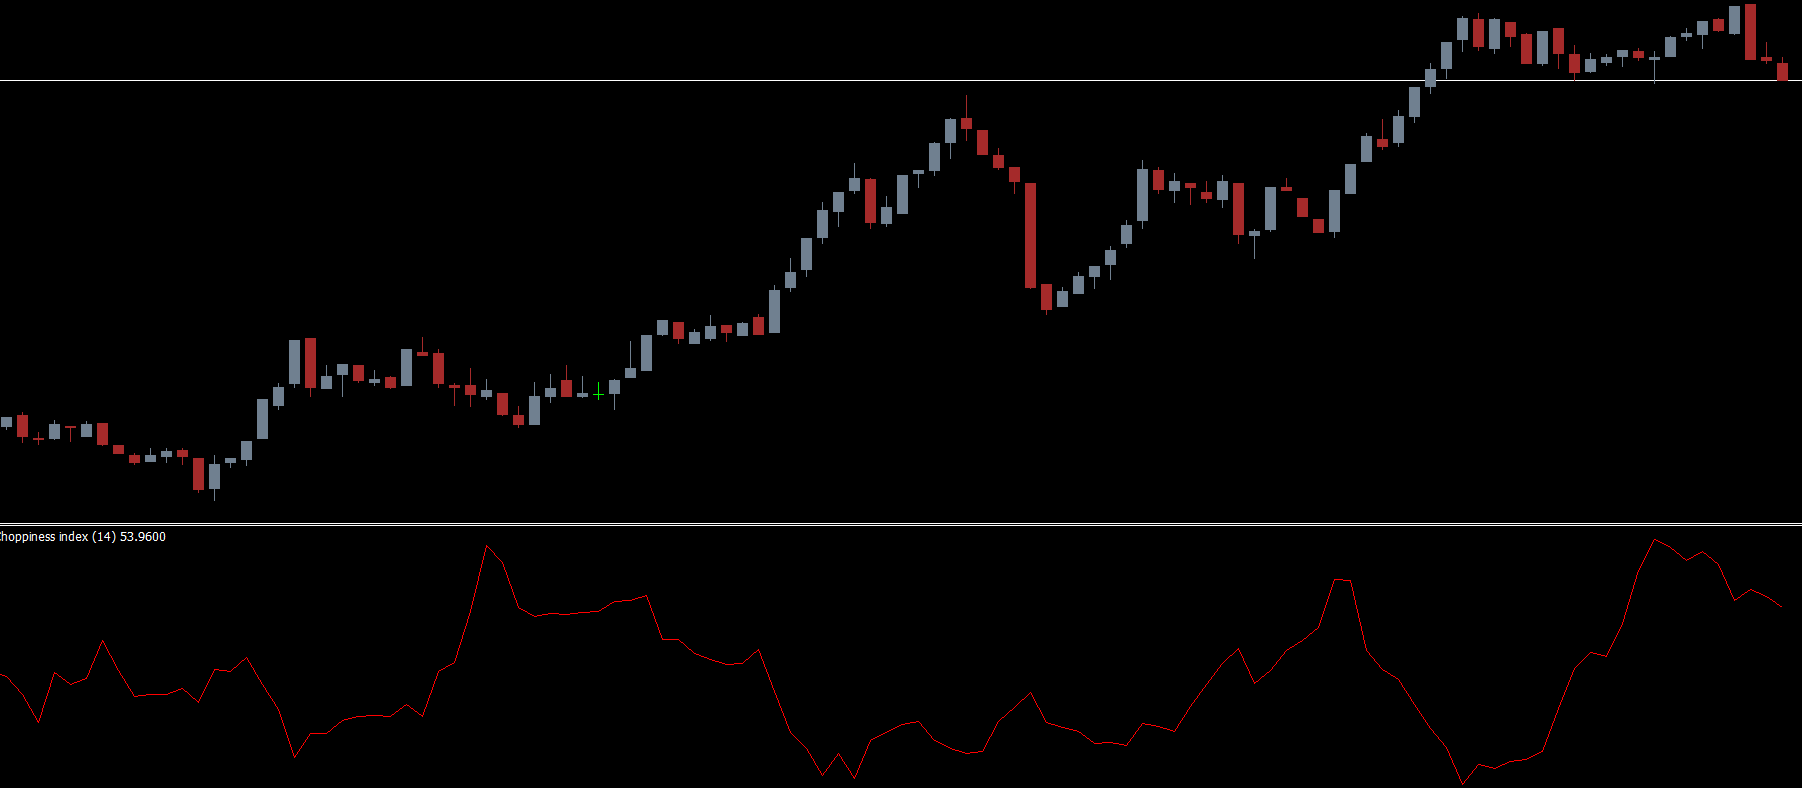
The indicator is based on chaos theory and fractal geometry, using HIGH and LOW price levels to calculate market behavior. When plotted in a separate window on the MT4 chart, the indicator displays values as red lines that oscillate between choppy and trending zones.
Above 61.8 → market is choppy or sideways
Below 38.2 → market is trending (uptrend or downtrend)
This simple structure allows traders to quickly determine whether to prepare for breakout trades or range-bound setups.
Why the Choppiness Index Indicator for MT4 Matters
Knowing whether a market is trending or consolidating helps traders:
Avoid trading in noisy, unstable conditions
Ride trends confidently
Enter breakouts early
Plan profitable strategies based on real Market Structure
The indicator also prevents many common trading mistakes, such as entering trend strategies during consolidation or trying to scalp during strong trends.
Default Trading Setup
In the standard version, the indicator identifies choppy and trending zones using Fibonacci-based levels (38.2 and 61.8). For example, when the indicator reading breaks below 38.2, it signals the start of a trend. This is often used as a cue for BUY or SELL entries depending on the direction of the price.
Traders can:
BUY breakouts when the value drops below 38.2 in an upward movement
SELL breakouts when the value drops below 38.2 in a downward movement
Once the trend begins, the indicator helps traders ride the move until choppiness begins to rise again.
Modified Trading Approach for Better Accuracy
Some traders prefer customizing the indicator to make the choppy and trending zones clearer. By adjusting the 38.2 and 61.8 levels, traders can enhance the readability of the chart.
A common technique is:
When values hit 61.8 but fail to break above it for three consecutive attempts, it signals the end of choppiness and potential start of a trend.
Conversely, when levels remain above 61.8 consistently, it confirms the market is still in consolidation.
This setup works particularly well for intraday traders who frequently encounter sideways price movements between support and resistance zones.
How to Trade Sideways Markets with the Choppiness Index
Sideways markets are often frustrating for traders, especially those waiting for trends. However, the Choppiness Index helps identify these conditions early so traders can switch to range-based strategies.
For example:
Buying near support
Selling near resistance
Using oscillators like RSI as confirmation
Avoiding breakout trades when the index is above 61.8
This flexibility allows traders to prepare strategies for both trending and non-trending markets.
Best Practices for Using the Indicator
Always confirm signals with Price Action
Combine with tools like Fibonacci levels or trendlines
Adjust indicator settings during strong trending phases
Avoid relying on the indicator alone—use it for context, not blind signals
Conclusion
The Choppiness Index Indicator for MT4 is an essential tool for forex traders who want to understand market structure accurately. It quickly shows whether the market is trending or moving sideways, helping traders avoid costly mistakes and build effective strategies. Easy to install, beginner-friendly, and free to download, this indicator should be part of every trader’s toolbox.
For more powerful trading tools and free indicators, visit IndicatorForest.com today and explore our complete indicator library.
FAQ
1 Download
Published:
Nov 25, 2025 21:35 PM
Category: