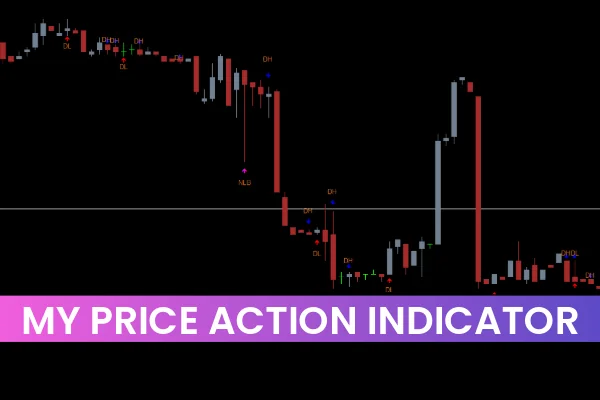
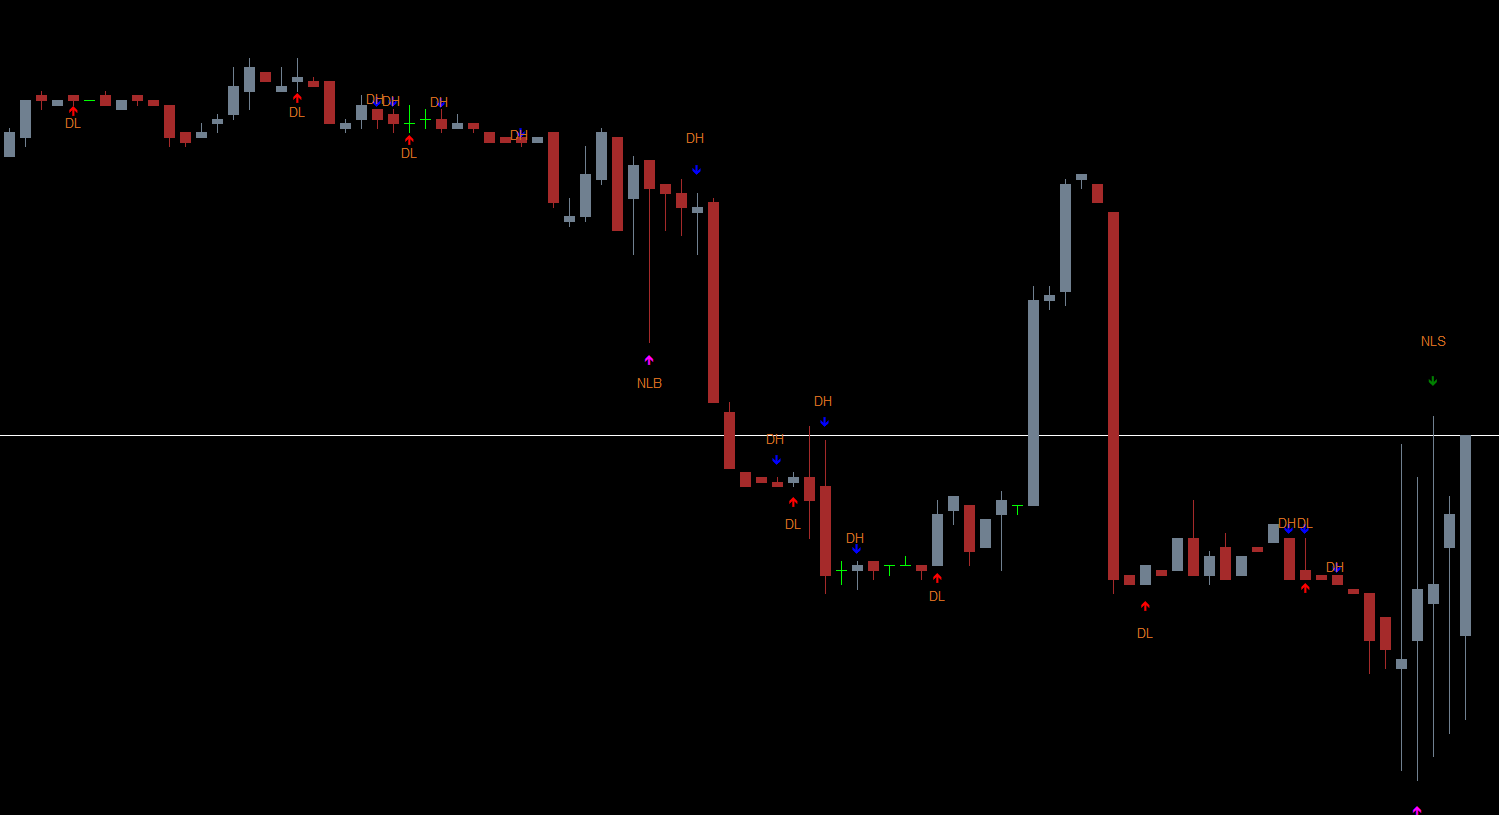
The My Price Action Indicator highlights significant candlesticks where price behavior suggests a potential shift in momentum. It uses colored arrows, which appear above or below candles, to mark strong price action signals. These arrows represent key rejection points, wick formations, and pressure zones.
However, the indicator should not be used as a standalone entry tool. Traders must understand what each arrow color signifies and combine it with structure analysis, Support And Resistance, and trend direction for more accurate decisions.
How the Indicator Works
The indicator functions primarily by analyzing candle shadows (wicks). Wicks reveal the true intentions of market participants:
Long lower wicks indicate buying pressure.
Long upper wicks indicate selling pressure.
The My Price Action Indicator highlights these candles, helping traders quickly find exhaustion points and high-probability setups. Instead of manually scrolling through charts, you instantly see areas of interest where price may reverse or continue.
For example:
A candle with a long downside wick shows strong rejection from lower levels, suggesting buyers are stepping in. This often creates a potential long trade opportunity.
My Price Action Indicator Trading Strategies
Below are the recommended trading setups that use specific input values and simple Market Structure principles.
Buy Setup (Long Position)
Settings:
Timeframe: H4 (4-hour)
hightwick1: 50
hightwick2: 25
lowtwick1: 50
lowtwick2: 25
Steps:
Identify price consolidation zones where the market is ranging.
Look for a pink arrow below a candle labeled NLB (New Low Break).
Enter a long trade when this candle forms.
Place stop-loss below the wick/shadow of the signal candle.
Close the trade when a green arrow appears above a candle labeled NLS (New Low Signal).
This setup captures early bullish reversals after price rejection.
Sell Setup (Short Position)
Settings (same as Buy setup):
hightwick1: 50
hightwick2: 25
lowtwick1: 50
lowtwick2: 25
Steps:
Spot consolidation or range areas.
Look for a green arrow above a candle labeled NLS.
Enter a short trade at that candle.
Set stop-loss above the wick/shadow of the signal candle.
Close the position when a pink arrow appears below with NLS label.
This method catches bearish reversals after rejection at higher levels.
Why Traders Prefer the My Price Action Indicator
Quickly identifies wick-based reversal points
Highlights strong Supply And Demand reactions
Works across all timeframes
Eliminates the need to manually scan hundreds of candles
Enhances accuracy for price action traders
Perfect for intraday, swing, and position trading
However, traders must combine it with tools such as market structure, trend direction, or support-resistance zones for best results.
Conclusion
The My Price Action Indicator MT4 is a valuable tool for understanding buying and selling pressure through wick analysis and candlestick behavior. It simplifies chart reading by highlighting key candles where significant price reactions occur. While the indicator improves efficiency, it should be used with additional confirmation tools or backtesting before trading a live account.
For more indicators, guides, and free downloads, visit IndicatorForest.com.
FAQ
1 Download
Published:
Nov 29, 2025 00:50 AM
Category: