Unlock Multi-Asset Insights with the Chart Overlay Indicator for MT5
In the sophisticated world of algorithmic trading and multi-asset analysis, understanding the correlation between different financial instruments is a critical edge. Whether you are trading Forex, Indices, or Commodities, price movements rarely happen in a vacuum. The Chart Overlay Indicator for MetaTrader 5 (MT5) is a professional-grade analytical tool designed to bring external market context directly onto your active trading screen. By allowing you to superimpose one instrument's Price Action over another, this indicator transforms your MT5 terminal into a comprehensive correlation workstation.
The Power of Comparative Technical Analysis
Most traders are forced to flip between multiple tabs to check how the US Dollar Index (DXY) is affecting EUR/USD or how Gold is reacting relative to the Japanese Yen. The Chart Overlay Indicator eliminates this friction by plotting a secondary "ghost" chart behind your primary price action. This allows for real-time visual comparison of lead-lag relationships and divergences.
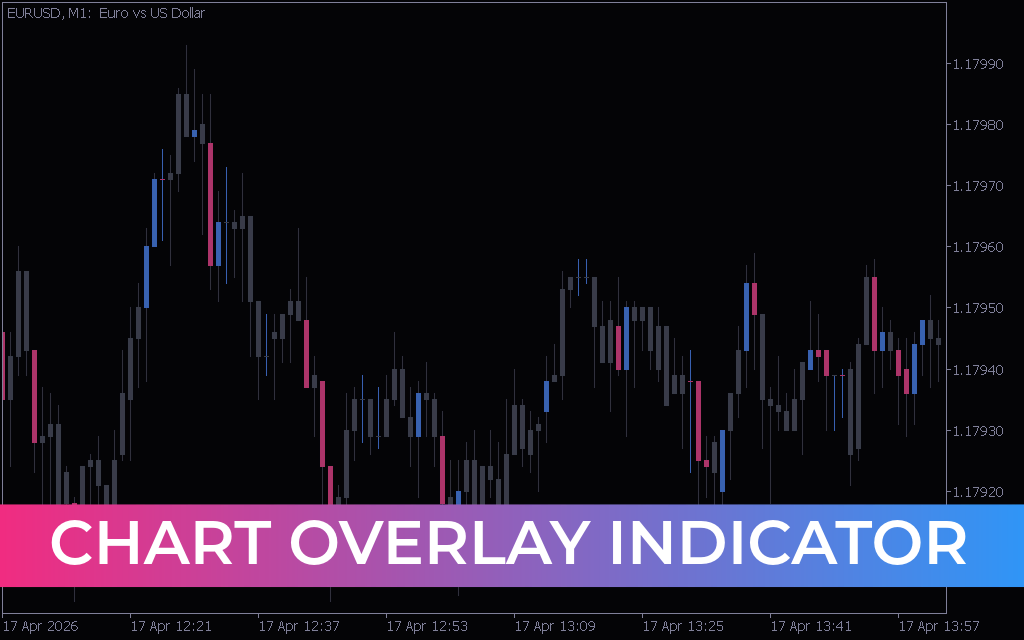
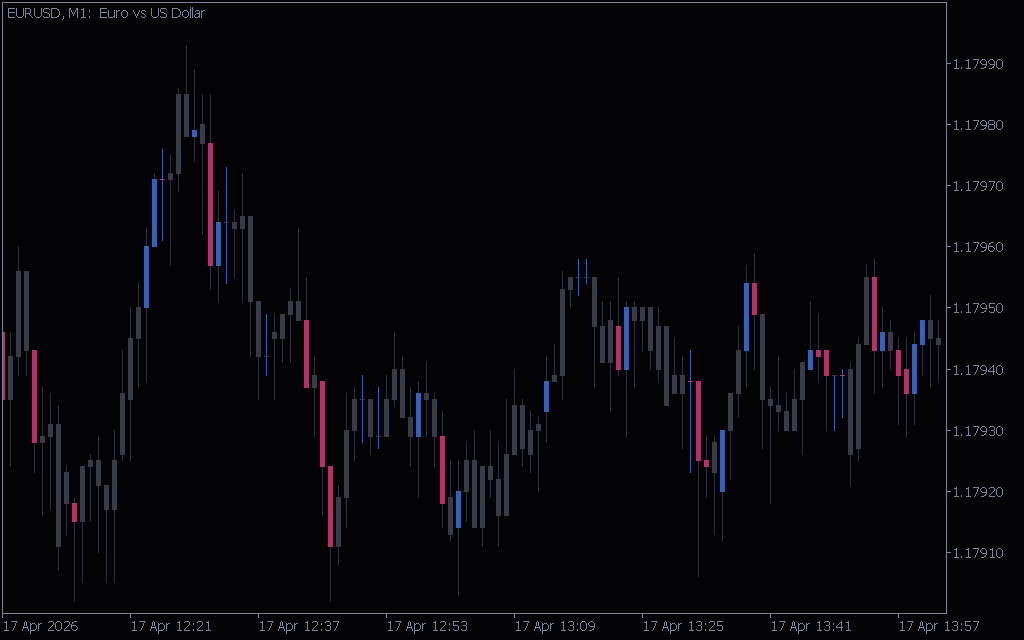
As demonstrated in technical analysis across various timeframes, such as the EUR/USD M1 chart, the Chart Overlay system provides an essential structural framework:
- Real-Time Correlation Tracking: Instantly see if two pairs are moving in lockstep (positive correlation) or in opposite directions (negative correlation). For example, overlaying AUD/USD on a Gold chart can reveal when the currency is failing to follow the metal's lead, signaling a potential Trend Reversal.
- Visual Divergence Identification: The most powerful trading signals often occur when correlated assets diverge. If the S&P 500 makes a new high but your overlay of the Nasdaq fails to do so, the Chart Overlay Indicator highlights this "Intermarket Divergence" immediately, warning of a false breakout.
- Customizable Scaling and Smoothing: To ensure the overlay doesn't clutter your workspace, the indicator includes advanced scaling algorithms. You can adjust the secondary chart's vertical scale and transparency, or even display it as a line chart to focus purely on closing prices.
- Multi-Timeframe Context: Professional traders often overlay a higher timeframe (like H4) on a lower timeframe (like M15) to ensure their scalping entries align with the "big picture" Market Structure.
Strategic Advantages for the Modern Trader
Integrating the Chart Overlay Indicator into your MT5 workflow moves your strategy beyond simple indicator-based trading and into the realm of professional intermarket analysis.
- Objective Market Sentiment: By seeing how multiple assets react to news events simultaneously, you gain a deeper understanding of true market "risk-on" or "risk-off" sentiment.
- Increased Confirmation Accuracy: Use the overlay as a final filter. Only take a "Buy" signal on your primary chart if the correlated "ghost" chart is also showing signs of bullish accumulation.
- Reduced Screen Fatigue: Stop managing dozens of open windows. Consolidation through overlaying allows you to focus on a single primary workspace while maintaining full awareness of global market drivers.
- Universal Multi-Asset Support: This tool is effective for comparing anything available in your MT5 Market Watch—from comparing Bitcoin against Ethereum to tracking the relationship between Brent Crude and the Canadian Dollar.
Conclusion
The Chart Overlay Indicator for MT5 is a definitive tool for any trader seeking a professional edge through intermarket analysis. By bridging the gap between isolated price action and global market correlations, it empowers you to navigate the financial markets with unparalleled clarity and confidence. Elevate your MT5 terminal today and master the art of multi-asset trading.
7 Downloads
Last Update:
Apr 17, 2026 19:19 PM
Published:
Feb 09, 2026 12:43 PM
Category: