The Zig Zag Channels Indicator trading signals offer traders a refined way to interpret price action on MetaTrader 4. Developed by the LuxAlgo research team, this advanced tool overlays zigzag lines and dynamic trend-based channels onto the chart. It reveals wave patterns, swing highs and lows, and directional flow—helping traders visualize structure and momentum with improved clarity.
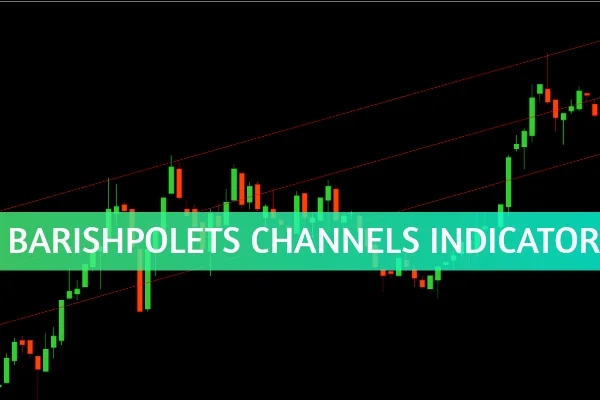
Unlike traditional zigzag indicators, this enhanced version adds parallel channel bands around each price leg, turning raw data into actionable trading insights. Whether you’re a swing trader or trend follower, this indicator can help you identify breakout points, trend strength, and potential reversals in real time.
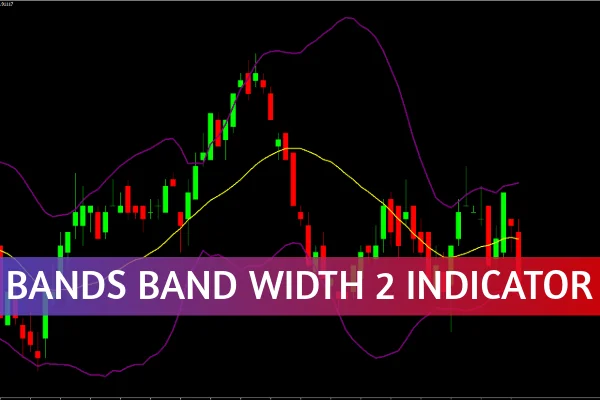
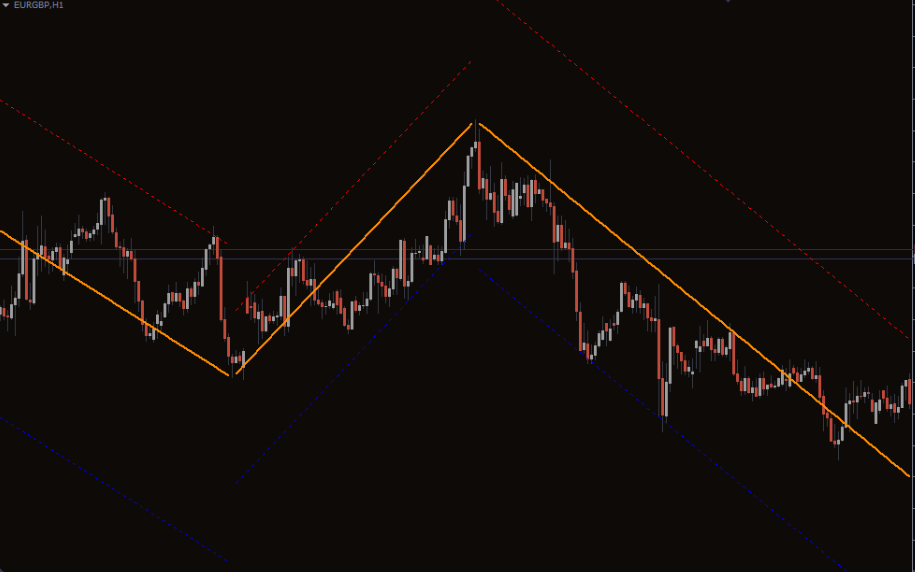
The Zig Zag Channels Indicator functions by mapping out market swings and then forming visual channels around each price leg. These channels represent volatility and slope—two critical aspects of price behavior.
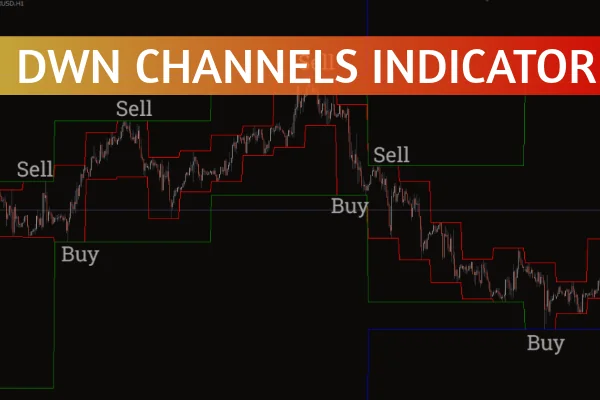
When a new swing high or low forms, the indicator automatically draws a corresponding channel to reflect that movement. The color-coded channels (for example, orange for bullish and red or blue for bearish) make it easy to see market direction at a glance.
H3: Key Features
Dynamic Channels: Each swing leg creates its own channel, adapting to price action.
Directional Clarity: Color-coded visualization highlights bullish and bearish momentum.
Breakout Alerts: Price crossing a channel boundary signals potential trend initiation or reversal.
Noise Reduction: Helps filter out false signals during sideways consolidation.
These features allow traders to stay aligned with real-time market structure, rather than reacting emotionally to short-term volatility.
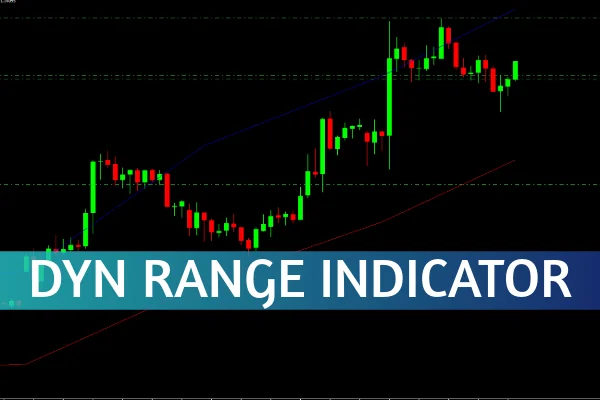
Interpreting Zig Zag Channels trading signals is straightforward yet powerful. When prices break above the upper channel boundary, it often signals the beginning of a bullish breakout. Conversely, when prices break below the lower boundary, it may indicate bearish momentum.
If the price respects channel limits without breaking them, it often reflects a controlled trend—useful for traders waiting for confirmed entries. A rejection at a channel extremity can highlight high-probability trade setups with tight stop-loss opportunities.
H3: Example Scenarios
Steep Upward Channels (Orange): Indicate strong buying pressure.
Steep Downward Channels (Red/Blue): Indicate selling dominance.
Flat Channels: Suggest consolidation or low volatility environments—ideal for breakout anticipation.
With consistent observation, traders can use these signals to spot early reversals or confirm ongoing trends, increasing both accuracy and confidence in their trading strategies.
Incorporating the Zig Zag Channels Indicator into your trading plan helps you see the market from a structural perspective. It assists with wave identification, trend continuation analysis, and risk management.
By visualizing the rhythm of market swings, traders can better align entries and exits with the market’s natural flow. This reduces exposure to false breakouts and enhances trade timing—key factors for long-term consistency.
The Zig Zag Channels Indicator by LuxAlgo transforms the classic zigzag concept into a powerful structural mapping system. It enhances trend identification, wave analysis, and breakout prediction—making it an essential addition to any serious trader’s toolkit.
Start using this tool today to refine your technical strategy and gain deeper market insight.
👉 Visit IndicatorForest.com to explore and download premium trading indicators that elevate your charting experience.
Published:
Oct 16, 2025 06:41 AM
Category: