Maximize Trading Efficiency with the M5 Parabolic SAR Histo Indicator
In the fast-paced environment of Forex trading, trend identification is the foundation of every successful strategy. While the classic Parabolic Stop and Reverse (SAR) is a staple for many traders, its standard visual representation can often clutter price charts, making it difficult to read candle formations during high volatility. The M5 Parabolic SAR Histo indicator solves this by transforming complex trend data into a clean, highly intuitive histogram located in a dedicated sub-window.
Streamlined Trend Visualization
The M5 Parabolic SAR Histo is designed to provide immediate clarity on market direction. By moving the trend dots off the main chart and into a vertical bar format, it allows traders to focus on Price Action while maintaining a constant awareness of the underlying trend bias.
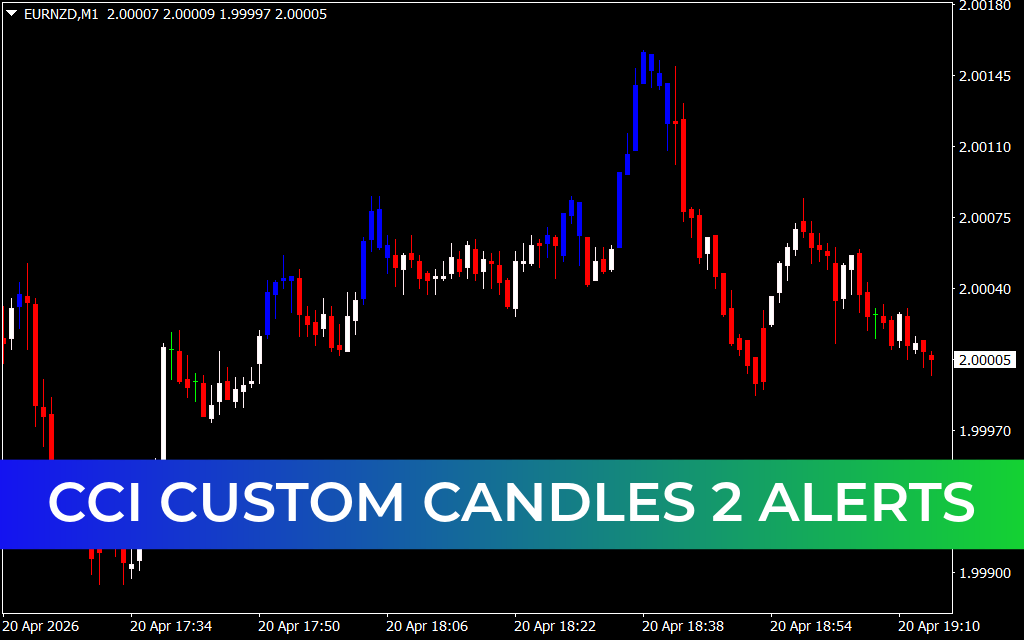
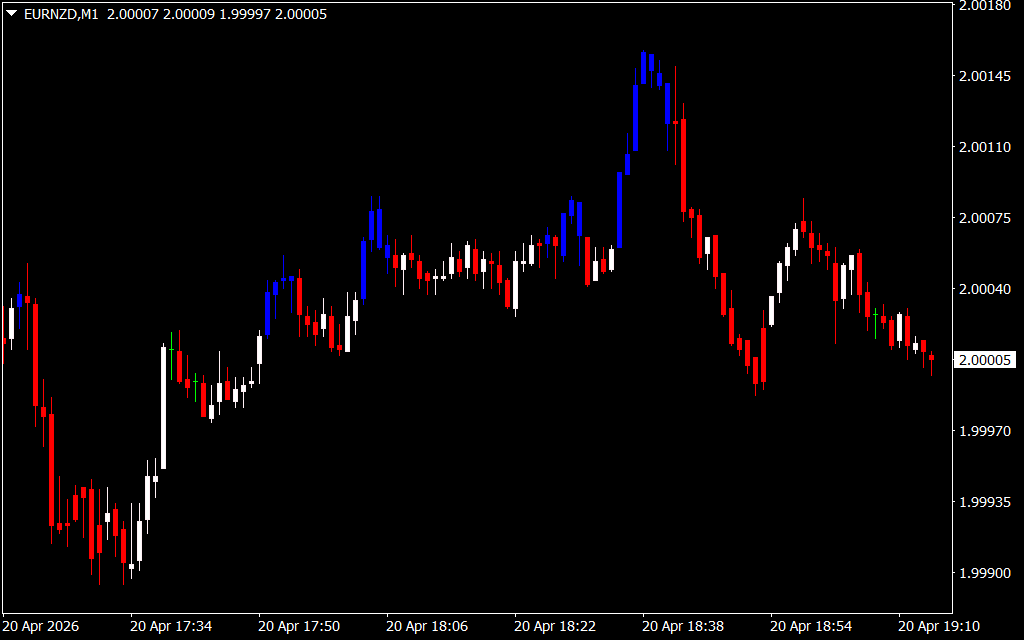
As seen on the EURNZD M5 chart, the indicator uses a simple color-coded system:
- Green Bars: Indicate a bullish trend. When the bars are green, the Parabolic SAR is positioned below the price, suggesting that buyers are in control.
- Red Bars: Indicate a bearish trend. Red bars signify that the SAR has flipped above the price, marking a shift toward selling pressure.
This visual simplicity is particularly beneficial on the 5-minute (M5) timeframe, where rapid changes in sentiment can occur within minutes. Traders no longer need to squint at dots; a quick glance at the histogram confirms whether the current momentum is in their favor.
Strategic Scalping and Trend Following
The primary strength of the M5 Parabolic SAR Histo lies in its ability to act as a powerful trade filter. Whether you are a scalper looking for quick pips or a trend follower aiming for larger moves, this tool provides the necessary structural guardrails.
- Entry Confirmation: A high-probability trade often begins at the very first bar of a color change. When the histogram switches from red to green, it signals a potential long entry. Conversely, a flip to red provides a mechanical signal to look for short opportunities.
- Trailing Stops and Exits: One of the original purposes of the SAR is to define exit points. With the histogram, traders can remain in a winning position as long as the color remains consistent, only exiting when the bars change color.
- Reducing Whipsaws: By using the M5 Parabolic SAR Histo alongside other indicators like the RSI or MACD, traders can filter out minor price noise. If your primary strategy gives a "Buy" signal but the histogram is still red, it serves as a warning to wait for better alignment.
Why Every MetaTrader User Needs This Edge
The M5 Parabolic SAR Histo is a professional-grade modification of a legendary tool. It removes the visual distraction of traditional chart overlays and replaces them with a streamlined momentum dashboard. In liquid pairs like EURNZD, where price can be erratic, having a clear vertical representation of Trend Strength is an invaluable asset.
By integrating this indicator into your MetaTrader setup, you gain a cleaner workspace and faster decision-making capabilities. It transforms raw data into actionable intelligence, ensuring that you stay on the right side of the market with confidence and discipline.
1 Download
Last Update:
Apr 20, 2026 22:16 PM
Published:
Feb 03, 2026 15:52 PM
Category: