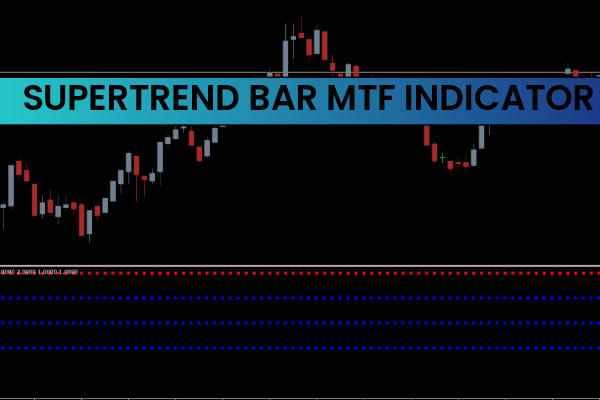
The indicator functions by applying the Supertrend logic across multiple timeframes. It checks the trend direction on each timeframe and displays a corresponding colored square beneath the chart:

Blue Square (Bullish) → Suggests upward momentum across that timeframe.
Red Square (Bearish) → Indicates downward pressure and selling dominance.
For example, the two 4H squares show the trend status of two consecutive 4-hour periods. When all four timeframes show blue, the market is strongly bullish; if all are red, it’s strongly bearish.
This multi-timeframe analysis helps traders confirm the strength of a trend and avoid false entries. It’s especially helpful for those who trade based on Trend Continuation setups or Price Action confirmation.
Custom Settings and Timeframe Flexibility
One of the key advantages of this indicator is its customization. You can adjust the timeframes to suit your trading style. For example:
Scalpers can monitor M5, M15, M30, and H1.
Swing traders might choose H1, H4, D1, and W1.
This flexibility allows you to create your own multi-timeframe setup that aligns with your strategy — whether short-term or long-term.
How to Use the Supertrend Bar MTF Indicator for Trading
While the Supertrend Bar MTF Indicator doesn’t directly issue BUY/SELL signals, it serves as a confirmation tool. Traders should combine it with other indicators like RSI, MACD, or Moving Averages to time entries and exits more precisely.
Example usage:
When the indicator shows consistent blue squares, it confirms an uptrend — consider long trades.
When it shows consistent red squares, it signals a downtrend — look for short trades.
Mixed colors (blue/red alternation) suggest market indecision — it’s best to stay out until the trend aligns across all timeframes.
⚠️ Tip: The indicator may produce false readings on lower timeframes, especially during volatile sessions. Use it alongside higher-timeframe analysis for stronger accuracy.
Best Settings for the Supertrend Bar MTF Indicator
There is no universal “best” setting — it depends on your trading style:
Scalpers: Focus on short-term (M15–H1) charts.
Day traders: Use M30–H4 combinations.
Swing traders: Opt for higher timeframes like H4–D1–W1.
Adjusting the default periods can help you match the indicator’s sensitivity to your preferred trading frequency.
How to Confirm Supertrend Signals
To confirm the trend:
Blue squares across multiple timeframes → Uptrend confirmed → Look for buy setups.
Red squares across multiple timeframes → Downtrend confirmed → Look for sell setups.
Mixed colors → Wait for alignment before entering any trade.
By ensuring all squares align in the same color, you can filter out weak trends and trade only when multiple timeframes agree — improving accuracy and confidence.
Conclusion
The Supertrend Bar MTF Indicator for MT4 offers traders a clear and efficient way to visualize trend direction across several timeframes simultaneously. It simplifies market analysis by using color-coded squares, allowing for instant recognition of bullish or bearish momentum.
Although it doesn’t generate direct entry signals, this indicator works best as a trend confirmation tool alongside other technical indicators. Whether you’re a beginner or an advanced trader, the Supertrend Bar MTF Indicator enhances your ability to identify consistent market trends and avoid indecisive phases.
You can download the Supertrend Bar MTF Indicator for free and start integrating it into your MT4 trading setup today.
FAQ
1 Download
Published:
Nov 11, 2025 11:07 AM
Category: