The Brooky PSAR Levels Indicator is a powerful trading tool designed for MetaTrader 4 (MT4) users who seek a more comprehensive understanding of market dynamics. Unlike the standard Parabolic SAR (PSAR), which only provides directional bias, this advanced version integrates support and resistance levels directly into the PSAR framework. By combining these two critical concepts, traders gain a clearer view of trend reversals, breakouts, and price reaction zones.
The Brooky PSAR Levels Indicator for MT4 automatically plots these levels, helping traders identify areas where price has previously reacted or reversed. This allows for more precise trade entries, exits, and stop-loss placements — ultimately improving your technical analysis and trading accuracy.
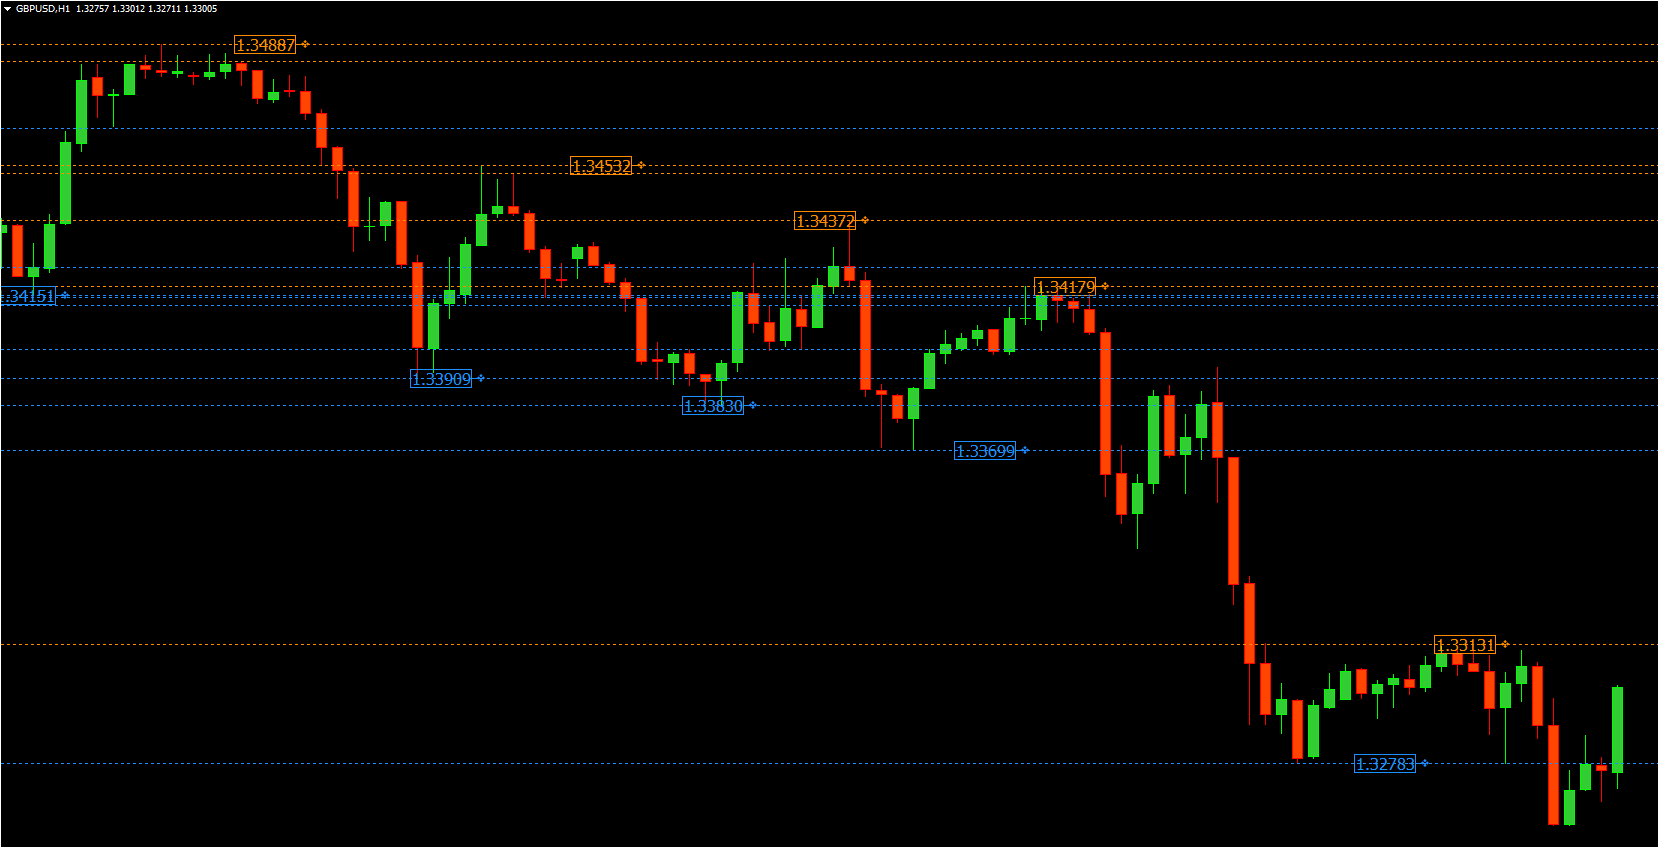
The indicator uses the Parabolic SAR formula as a foundation but enhances it by mapping historical PSAR points that align with strong price reactions. These are then displayed as horizontal support and resistance lines on your MT4 chart.
High PSAR Levels are plotted as potential resistance zones, often highlighted in red or orange.
Low PSAR Levels are shown as support zones, usually in blue or green.
When the market price approaches a high PSAR resistance level, traders can watch for potential reversals or breakout opportunities. Similarly, when price touches a low PSAR support level, it may indicate buying pressure or the beginning of a bullish trend.
This clear visualization helps both new and experienced traders spot trading opportunities faster and with more confidence.
Traditional PSAR indicators can feel limiting because they only show dots above or below price. The Brooky version expands this by revealing historical reversal zones, making it easier to interpret the broader market structure.
Whether you are a trend trader, breakout trader, or counter-trend strategist, this indicator provides actionable data. It helps identify trend continuation setups, reversal signals, and entry zones that align with your preferred method.
By identifying key support and resistance areas, traders can set more accurate stop-loss and take-profit levels. This reduces guesswork and enhances the risk-to-reward ratio of each trade.
The Brooky PSAR Levels Indicator offers a clean, color-coded interface, allowing traders to make quick decisions without overloading their charts.
When using the Brooky PSAR Levels Indicator, traders should pay attention to how price reacts at the plotted levels:
Price Near High PSAR Resistance: Potential reversal or breakout above the resistance level.
Price Near Low PSAR Support: Possible bullish reversal or continuation from support.
Breakout Confirmation: When price closes beyond a PSAR level, it can signal strong momentum in that direction.
By combining these signals with other indicators — such as Moving Averages, RSI, or MACD — traders can form a complete trading strategy with improved accuracy.
Installing the Brooky PSAR Levels Indicator for MT4 is straightforward:
Download the indicator file from IndicatorForest.com.
Place it in your MT4 Indicators folder.
Restart MT4 and attach it to your chart from the “Navigator” panel.
Adjust visual settings, such as color and level thickness, to your preference.
Once applied, you’ll instantly see dynamic support and resistance levels derived from PSAR data.
The Brooky PSAR Levels Indicator is more than just a PSAR upgrade — it’s a complete support and resistance mapping system built on Parabolic SAR principles. By revealing zones where price historically reversed or paused, this indicator allows traders to anticipate market movements with greater confidence.
Whether you trade forex, commodities, or indices, this indicator can significantly improve your technical analysis on MT4.
👉 Download the Brooky PSAR Levels Indicator today at IndicatorForest.com and start refining your trading strategy.
Published:
Oct 10, 2025 10:55 AM
Category: