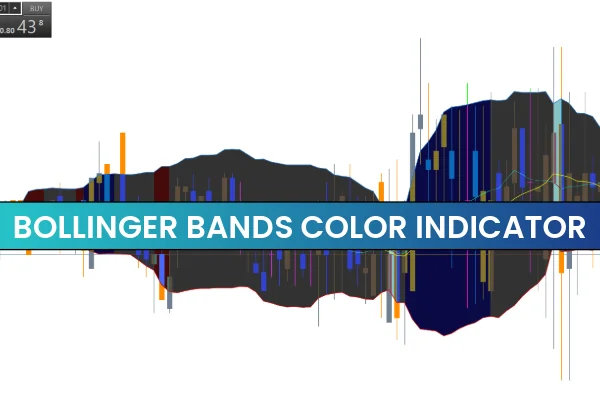
The Bollinger Bands Color Indicator for MT5 is a dynamic tool designed to track volatility and identify high-probability trading conditions. It enhances the classic Bollinger Bands concept by using color-coded signals, making it easier for traders to spot trends, breakouts, pullbacks, and reversals. Because the indicator adjusts based on standard deviation, it automatically expands and contracts as market volatility changes, giving traders a visual roadmap of potential price movement.
Unlike traditional Bollinger Bands that remain the same color, this improved version changes color between blue and red to reflect shifts in market sentiment. This allows both new and experienced traders to quickly assess whether conditions favor buying or selling. The Bollinger Bands Color Indicator for MT5 shows real-time volatility and helps traders detect when the market is trending strongly or consolidating.
What the Bollinger Bands Color Indicator Shows
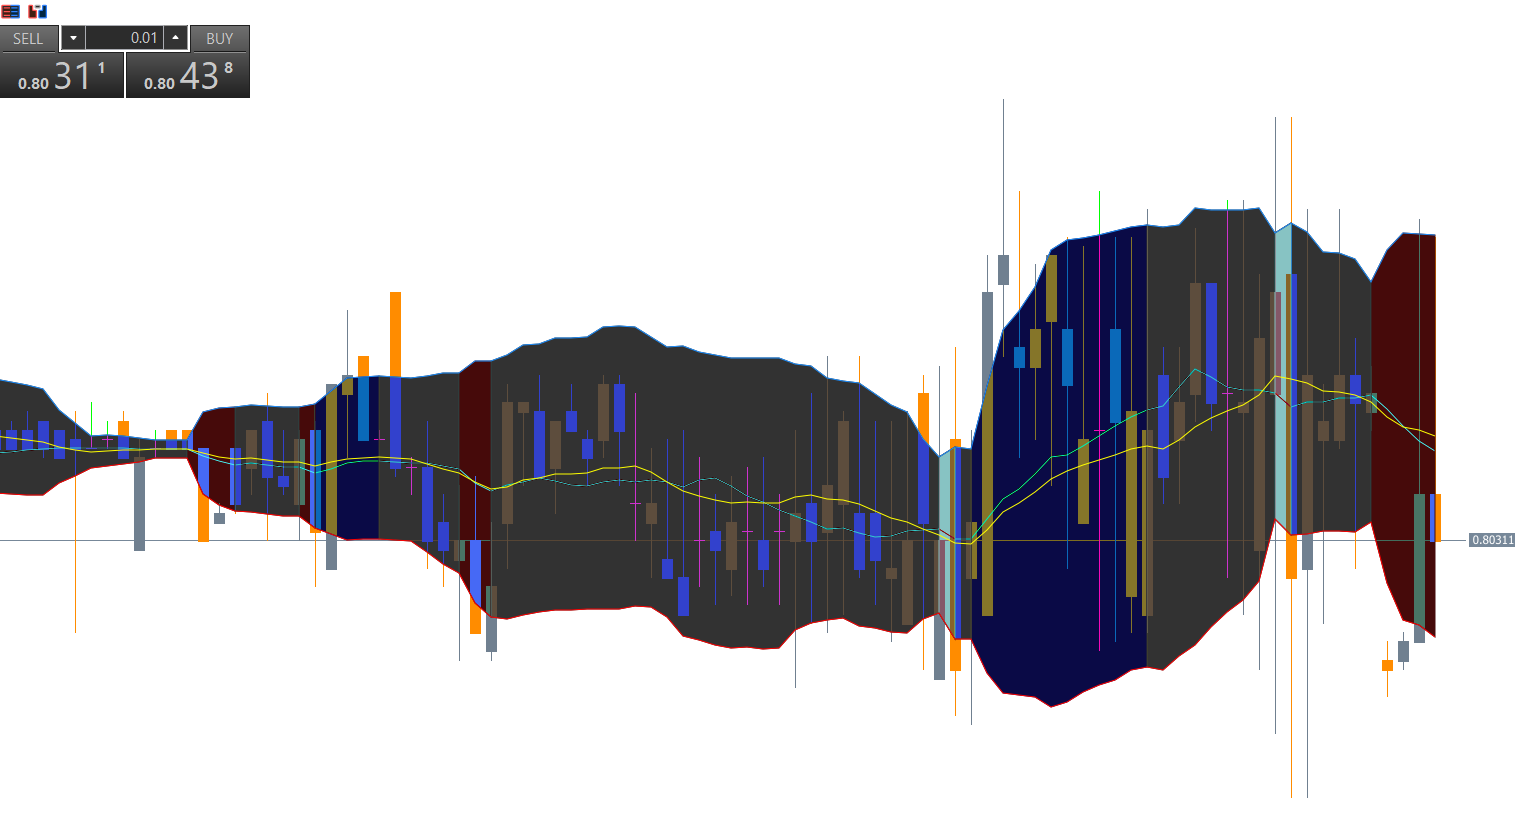
The indicator includes three primary components:
A light-blue moving average, which serves as the middle band
An upper band
A lower band
The upper and lower bands are calculated using standard deviation, making them responsive to volatility. When the bands widen, it signals increasing volatility—usually during breakouts or strong trends. When the bands narrow, it reflects decreasing volatility—often indicating consolidation or a range-bound market.
High and Low Volatility Signals
High volatility: The bands expand significantly, suggesting an increase in trading activity and potential breakout opportunities.
Low volatility: The bands contract tightly, signaling reduced movement and the likelihood of a breakout forming soon.
How to Trade Using the Bollinger Bands Color Indicator for MT5
This indicator’s versatility allows traders to use it for intraday, swing, or long-term trading. It works efficiently for trends, ranges, breakouts, and bounce strategies. The color shifts between blue and red provide simple yet effective trade signals.
Buy Conditions
The indicator provides a BUY signal when:
A candle opens and closes above the light-blue middle moving average
Both upper and lower bands turn BLUE
Market Structure supports bullish movement
This setup is especially powerful on higher timeframes like H4 or daily, where false signals are less frequent.
Sell Conditions
A SELL signal forms when:
A candle opens and closes below the middle moving average
Both bands turn RED
Price Action confirms a bearish environment
These rules help filter out market noise and improve entry accuracy.
Trading Different Market Conditions
Trend Trading
When both bands remain the same color (blue for bullish, red for bearish) and continue expanding, momentum is strong. Traders can ride the trend until color changes or price crosses the middle line.
Range Trading
During narrow periods, traders should wait for a breakout since low volatility often leads to strong directional movements.
Bounce Trading
If price rejects the outer band and moves back toward the middle moving average, traders can anticipate a temporary reversal.
Conclusion
The Bollinger Bands Color Indicator for MT5 simplifies volatility analysis by color-coding the market’s behavior. It provides clearer buy/sell signals than standard Bollinger Bands and works well across various market conditions. Although highly accurate, the best performance is achieved when combined with price action or other non-correlated indicators.
Download this indicator for free on IndicatorForest.com and enhance your MT5 trading strategy with a reliable volatility-based tool.
FAQ
3 Downloads
Published:
Nov 29, 2025 09:13 AM
Category: