The Automatic Channel indicator is a powerful technical tool for traders looking to identify key Support And Resistance levels on any price chart. By automatically drawing parallel lines based on market trends, this indicator simplifies market analysis and helps you make informed trading decisions. Whether you are trading forex, stocks, or cryptocurrencies, the Automatic Channel indicator can improve your ability to spot trend reversals, breakout points, and optimal entry and exit positions.

How to use the Automatic Channel indicator?
There are several ways to use the Automatic Channel indicator effectively. Its primary purpose is to show where the price may pause due to support or resistance. For instance, in an ascending channel, the parallel lines will slope upwards.
If the price is below the channel lines, they act as resistance.
If the price is above, the lines act as support.
The mid-line serves as a pivot point. If the price falls below the mid-line in an uptrend, the trend is likely weakening.
Traders can also use the indicator as a strategy tool, choosing either reversal or breakout trades depending on market conditions and other technical factors.
Automatic Channel indicator strategy
Here’s a simple yet effective trading approach using the Automatic Channel indicator:
Automatic Channel buy setup
Price should touch the lower boundary of the channel.
Wait for price rejection near the channel line.
Enter long after a bullish candlestick forms.
Set stop-loss slightly below the rejection candle’s low.
Place take profit near the mid-line or next parallel line depending on trend strength.
Automatic Channel sell setup
Price should reach the upper boundary of the channel.
Wait for price rejection near the channel line.
Enter short after a bearish candlestick appears.
Set stop-loss slightly above the rejection candle’s high.
Place take profit near the mid-line or next parallel line depending on Trend Strength.
Automatic Channel indicator conclusion
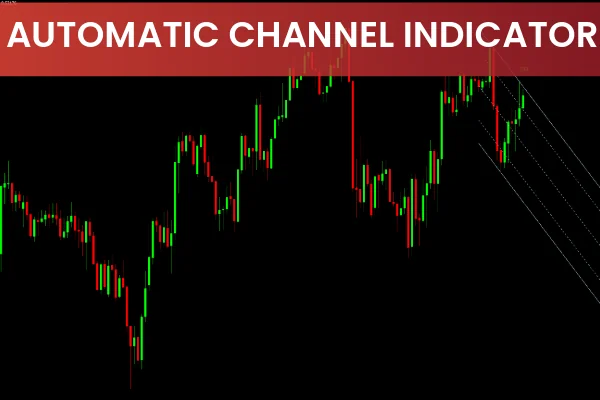
The Automatic Channel indicator overlays five parallel lines on your chart to highlight potential support and resistance zones. These lines can guide entries and exits, improving your trade management. However, it is important not to rely solely on this indicator. Combining it with other trend tools and market analysis techniques can significantly enhance your win rate.
For more trading strategies and indicators, visit IndicatorForest.com.
FAQ
13 Downloads
Published:
Nov 24, 2025 11:29 AM
Category: