Master Market Volatility: A Guide to the Min Max RSI Indicator
The Relative Strength Index (RSI) has long been a staple in the toolkit of technical analysts worldwide. However, in today’s highly volatile markets, standard oscillators can often produce "static" or premature signals. Enter the Min Max RSI Indicator, a refined evolution of the classic RSI designed to provide a clearer, more structured view of price momentum and extreme market conditions. By tracking the localized highs and lows of strength, this indicator helps traders identify precise entry and exit points with greater confidence.
What is the Min Max RSI Indicator?
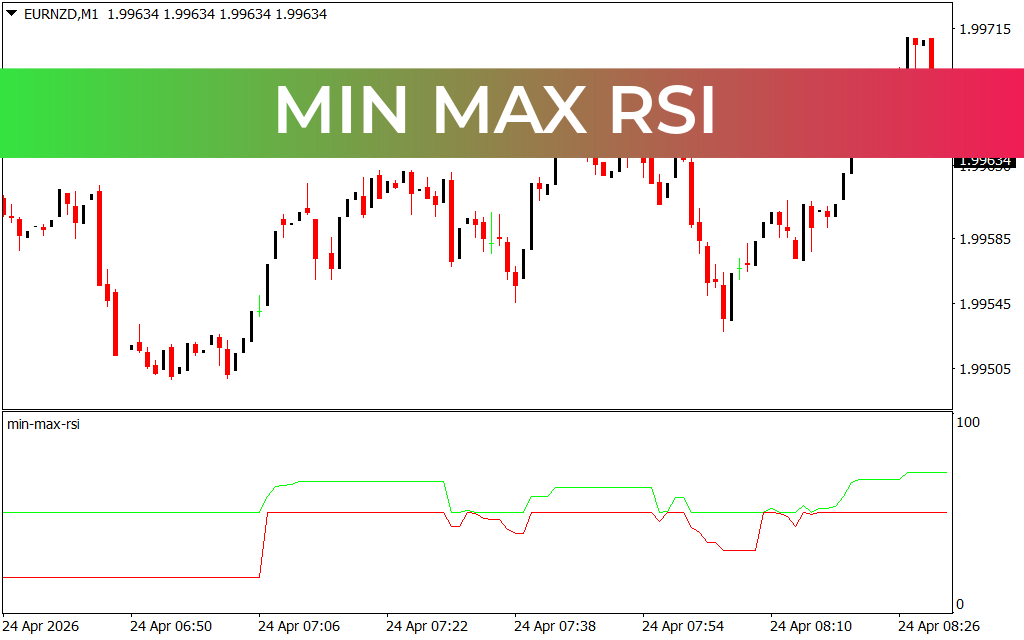
The Min Max RSI is a specialized momentum oscillator that sits below your main price chart. While a traditional RSI calculates the speed and change of price movements, the Min Max version focuses on the range of that strength over a specific period. As seen in the EURNZD M1 chart, the indicator is typically represented by two distinct lines:
- The Green Line (Max): Represents the upper boundary of momentum, tracking the highest relative strength levels reached.
- The Red Line (Min): Represents the lower boundary of momentum, tracking the lowest relative strength levels recorded.
This "channel-style" representation allows traders to see not just where the RSI is, but how it is behaving relative to its recent extremes.
Key Benefits for Day Traders and Scalpers
The primary advantage of the Min Max RSI is its ability to visualize momentum compression and expansion.
- Trend Stability: When the green and red lines are moving in parallel and trending upward, it confirms a strong, healthy bullish trend. Conversely, parallel downward movement confirms a stable bearish trend.
- Overbought and Oversold Clarity: In a standard RSI, levels like 70 and 30 are fixed. The Min Max RSI shows you the actual "ceiling" and "floor" of current market strength. When the red line begins to hook upward from a deep trough, it often signals a high-probability reversal long before a standard RSI might leave the oversold zone.
- Volatility Tracking: The gap between the green and red lines represents market volatility. A widening gap suggests increasing momentum and potential breakout opportunities, while a narrowing gap signals a period of consolidation where traders should exercise caution.
Strategic Trading Implementation
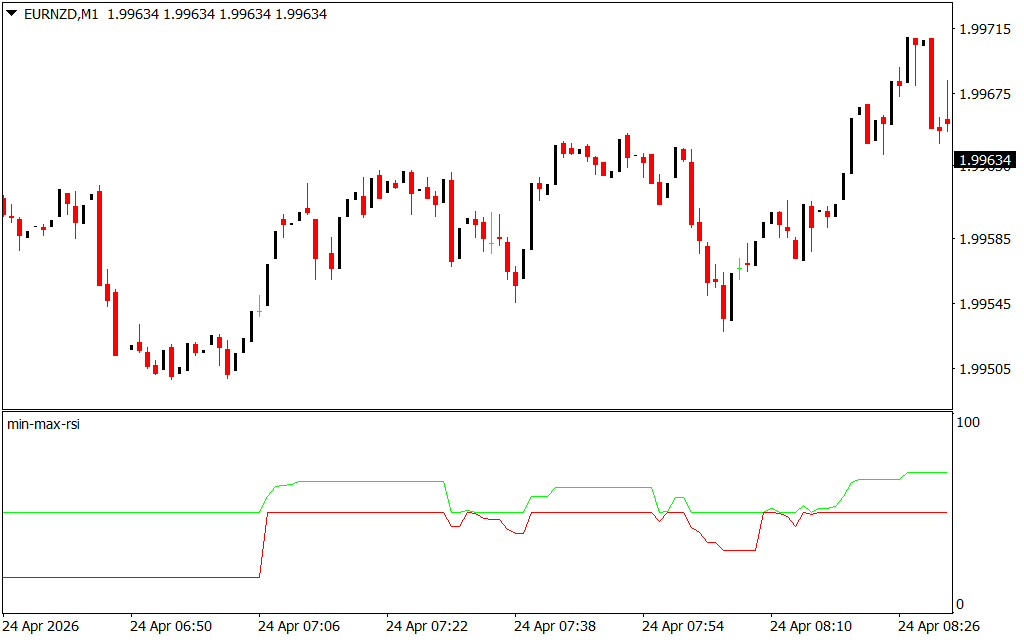
To get the most out of the Min Max RSI, traders should look for line crossovers and slope changes. In the provided M1 chart, notice the sharp vertical shift in both lines around 07:00. This indicates a sudden surge in buying pressure that reset the momentum floor.
For an effective entry strategy, look for the "Momentum Hook." When the price is in a retracement and the red (Min) line stabilizes and starts to turn upward while the green (Max) line remains elevated, it suggests that the dip is being bought and the primary trend is ready to resume.
Whether you are navigating the fast-paced 1-minute Forex markets or analyzing longer-term crypto trends, the Min Max RSI provides a mathematical framework to stay on the right side of momentum. It filters out the noise of minor fluctuations and keeps your focus on the levels that actually matter.
Meta Description
6 Downloads
Last Update:
Apr 24, 2026 15:32 PM
Published:
Feb 03, 2026 02:24 AM
Category: