The Arrows Curves Indicator for MT4 is a momentum-based breakout tool that helps traders identify strong directional moves in the market. It creates a dynamic price channel using two green lines that act as Support And Resistance boundaries.
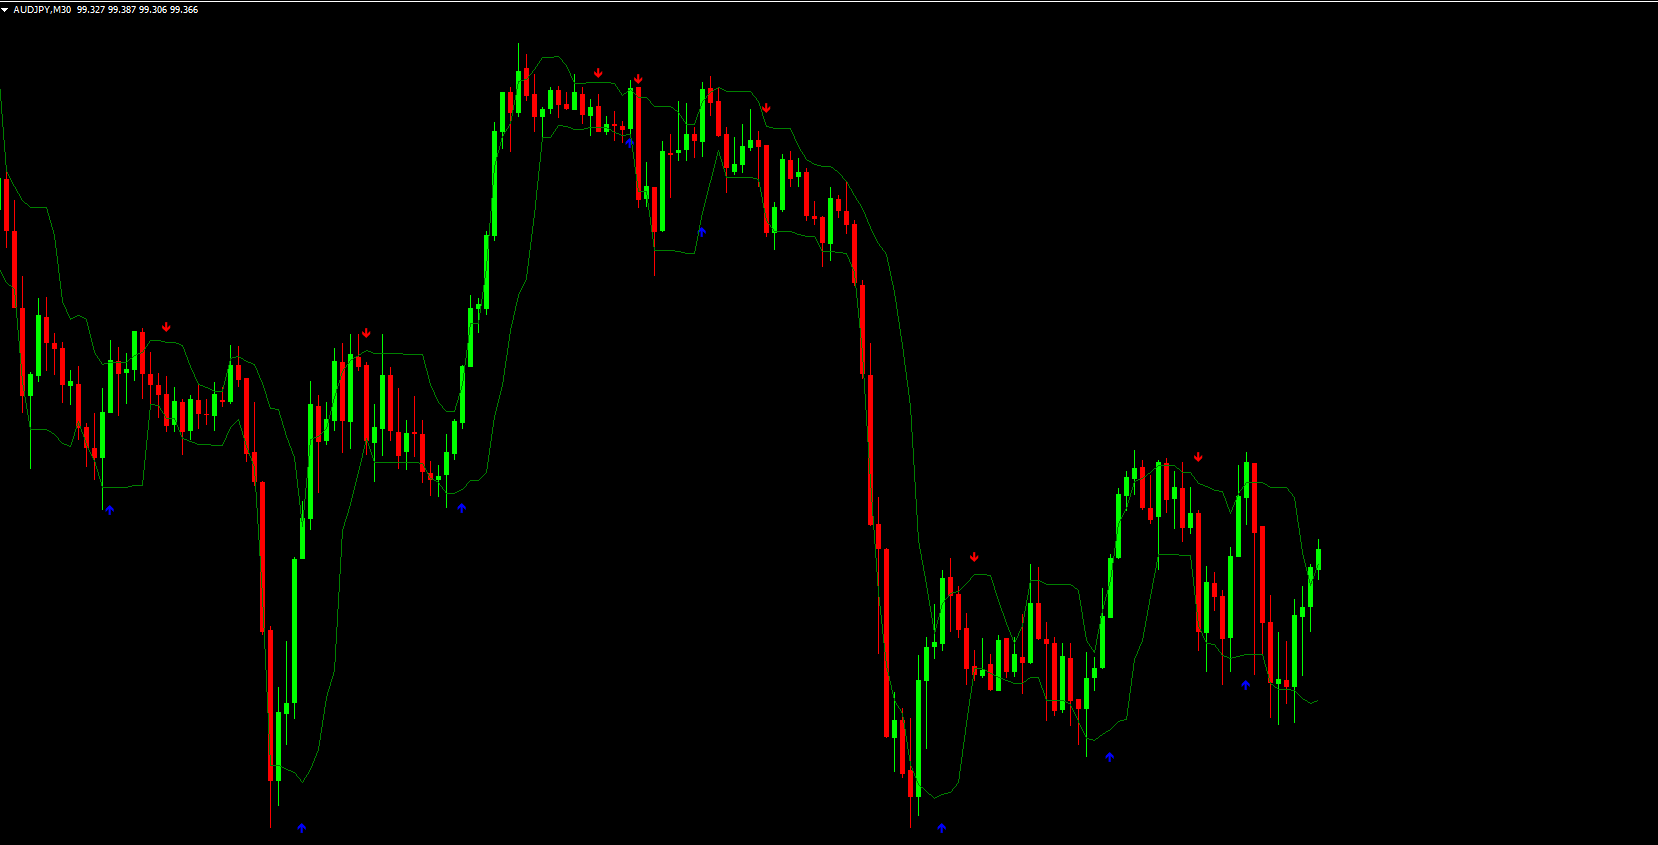
When the price breaks through these channel lines with momentum, the indicator plots colored arrows to signal potential trend continuations or reversals. The blue arrow indicates a bullish breakout, while the red arrow indicates a bearish breakout.
This simple yet effective setup allows traders to spot trade entries at breakout points, improving accuracy and timing in volatile market conditions.
How the Arrows Curves Indicator Works
The indicator’s logic is based on the interaction between Price Action and a dynamic channel. The two curved green lines move with price fluctuations, expanding and contracting according to market volatility.
Upper Green Line: Acts as a dynamic resistance level.
Lower Green Line: Serves as a dynamic support level.
Blue Arrow (Up): A buy signal, triggered when price breaks above the upper line with momentum.
Red Arrow (Down): A sell signal, triggered when price breaks below the lower line with momentum.
By combining these signals, the indicator gives traders an instant visual cue of when strong market moves are likely to occur.
How to Trade Using the Arrows Curves Indicator for MT4
Identify the Signal
BUY Signal: When a blue arrow appears below the price, it indicates a bullish breakout. Enter a long position or close any short trades.
SELL Signal: When a red arrow appears above the price, it indicates a bearish breakout. Enter a short position or close long trades.
Confirm the Breakout
To improve accuracy, use other confirmation indicators like RSI, MACD, or Moving Averages. Confirm that the market has enough momentum to sustain the breakout before entering a trade.
Manage Risk
Set a stop-loss just below (for BUY) or above (for SELL) the most recent swing point. Consider taking partial profits at nearby resistance/support levels to secure gains.
Exit the Trade
You can exit when:
An opposite signal arrow appears.
Price re-enters the green channel, suggesting momentum is weakening.
Why Use the Arrows Curves Indicator for MT4?
The Arrows Curves Indicator is suitable for traders who prefer momentum breakout strategies and want a clear visual guide.
Key Benefits:
Accurate Momentum Detection: Captures strong market movements quickly.
Dynamic Levels: Adapts automatically to market volatility.
Simple Interface: Arrows and color-coded channels make interpretation easy.
Versatile Usage: Works on all timeframes and major currency pairs.
Improved Timing: Helps identify entry and exit points before major breakouts.
Advanced Tips for Traders
For best results, combine the Arrows Curves Indicator for MT4 with:
Bollinger Bands: To verify volatility expansion.
Volume Indicators: To confirm breakout strength.
Trend Filters (like EMA): To align trades with the main trend direction.
This combination increases accuracy, reduces false signals, and enhances risk-to-reward ratios.
Conclusion
The Arrows Curves Indicator for MT4 is a reliable momentum Breakout Indicator that helps traders spot bullish and bearish breakouts based on dynamic price channels. By understanding the color-coded arrows and channel structure, traders can easily recognize high-probability trading opportunities.
If you’re looking for a simple yet powerful MT4 indicator that visually confirms breakout moments, the Arrows Curves Indicator is an excellent choice.
Visit IndicatorForest.com to download the Arrows Curves Indicator for MT4 and improve your Breakout Trading Strategy today.
FAQ
Published:
Nov 07, 2025 13:51 PM
Category: