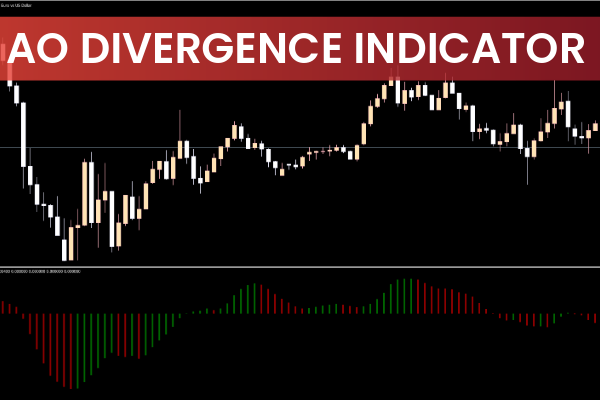
The AO Divergence Indicator, also known as the Awesome Oscillator Divergence Indicator, is a modernized extension of the traditional Awesome Oscillator (AO). It helps traders identify trend direction, momentum strength, and potential reversal points by analyzing the convergence and divergence of two simple moving averages (SMA).
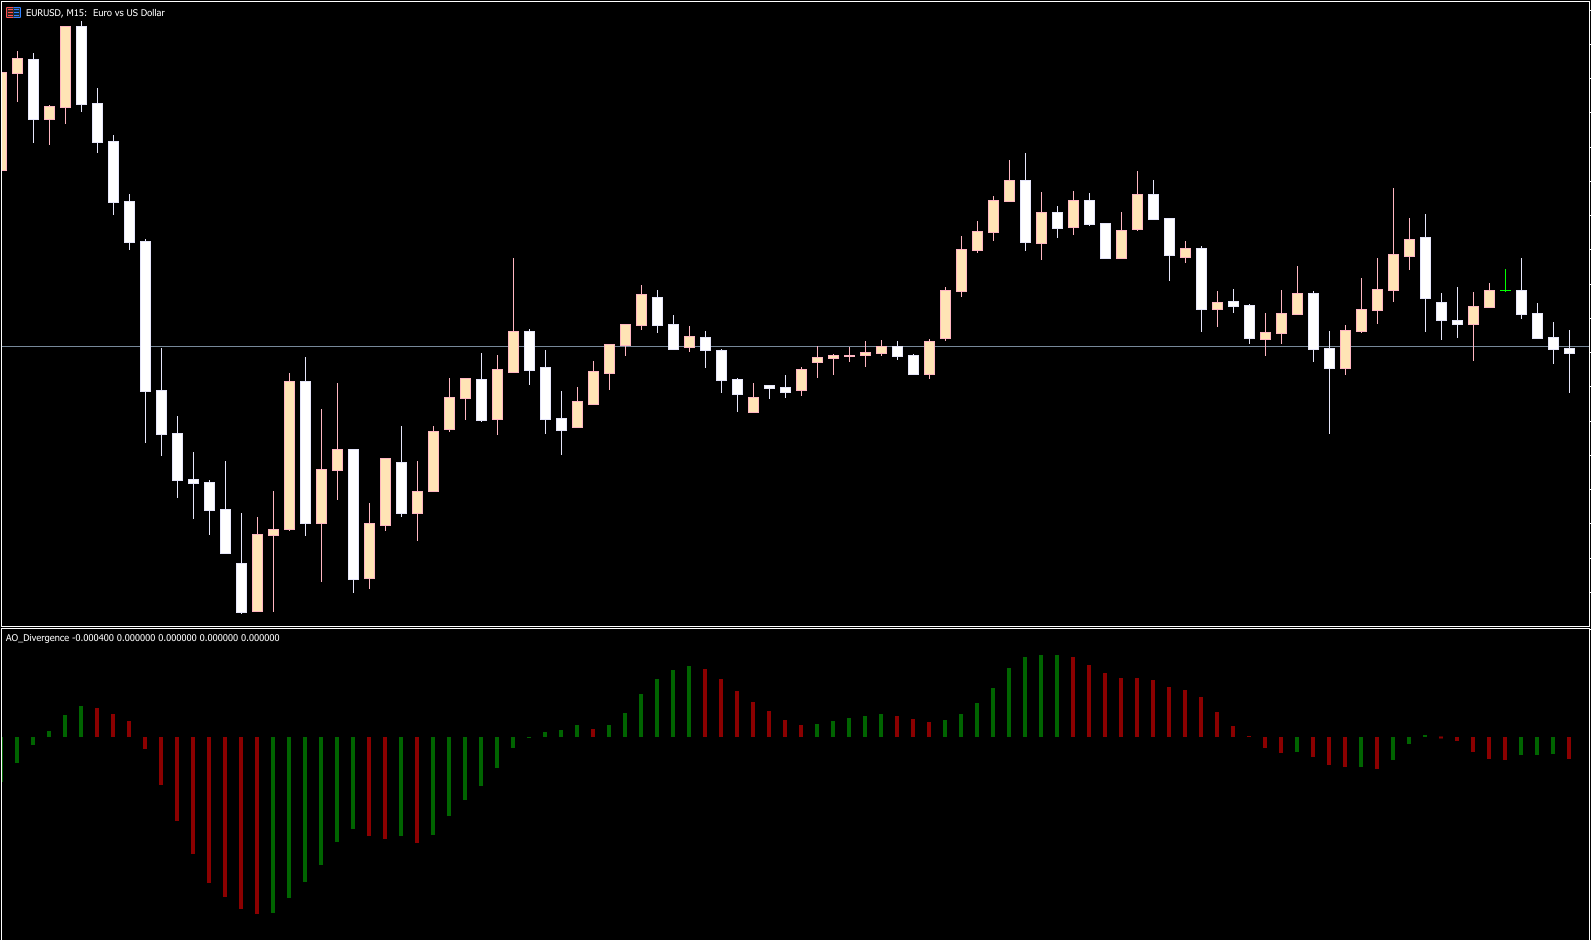
The indicator is displayed as a colored histogram in a separate window beneath the price chart. Its design provides visual clarity, with green bars indicating bullish momentum and red bars indicating bearish momentum. Additionally, the AO Divergence indicator automatically plots divergences and arrows to signal BUY and SELL opportunities, making it ideal for technical traders.
How the AO Divergence Indicator Works
The AO Divergence indicator is calculated as the difference between a fast SMA and a slow SMA. Divergences between the histogram and Price Action often indicate trend exhaustion or reversal points.
Histogram bars:
Green bars: Rising momentum, potential uptrend
Red bars: Falling momentum, potential downtrend
Divergence lines:
Red line: Marks bearish divergence
Blue line: Marks bullish divergence
Arrows:
Up arrow: Buy signal
Down arrow: Sell signal
Zero line:
Histogram crossing from below: Buy
Histogram crossing from above: Sell
This combination of histogram, divergences, and zero-line signals provides clear entry and exit points.
Trading Signals with the AO Divergence Indicator
BUY Signal
Bullish divergence: Price makes a lower low, but the AO histogram forms a higher low.
Up arrow appears confirming the buy signal.
Histogram is above zero or crossing upward from below.
Confirm with support/resistance or trend analysis for higher probability.
SELL Signal
Bearish divergence: Price makes a higher high, but the AO histogram forms a lower high.
Down arrow appears indicating a sell opportunity.
Histogram is below zero or crossing downward from above.
Validate with resistance levels or channels before entering.
Interpreting Histogram & Zero Line
During bullish momentum, the histogram rises above zero. After reaching a peak, if bars start falling but remain above zero, the trend is still up.
During bearish momentum, the histogram falls below zero. After reaching a minimum, if bars start rising but remain below zero, the downtrend is still intact.
The zero line acts as an additional confirmation of trend shifts:
Crossing upward signals a buy
Crossing downward signals a sell
This multi-layer approach ensures traders capture both Trend Continuation and reversal opportunities.
Benefits of Using the AO Divergence Indicator
Clear buy and sell signals using divergences, histogram, and zero line
Early Trend Reversal detection through divergence analysis
Works for all MT4/MT5 instruments and timeframes
Free to download and easy to install
Enhances precision in both short-term and long-term trading strategies
By combining divergence detection with histogram analysis, traders can reduce false entries and improve trade timing.
Conclusion
The AO Divergence Indicator is a reliable and intuitive tool for traders looking to spot bullish and bearish divergences, identify trend reversals, and generate precise entry and exit points. Its histogram, divergence lines, and zero-line signals make it easy to read, while its free availability makes it accessible to all traders. Incorporate the AO Divergence indicator into your MT4 or MT5 strategy to enhance market analysis and trading results.
FAQ
Published:
Nov 28, 2025 01:52 AM
Category: