Unlock Precise Trend Analysis with the Accumulative Swing Index
In the volatile world of financial markets, distinguishing between temporary price fluctuations and genuine trend shifts is the key to consistent profitability. While many indicators focus solely on closing prices, the Accumulative Swing Index (ASI) offers a more comprehensive view by evaluating the relationship between opening, high, low, and closing prices. Originally developed by J. Welles Wilder, this indicator is a professional-grade tool designed to reveal the "true" swing of the market.
What is the Accumulative Swing Index?
The Accumulative Swing Index is a cumulative total of the Swing Index. It acts as a trailing indicator that mirrors Price Action but with a critical advantage: it filters out market noise to show the underlying strength of a move. By mathematically weighing current price data against previous bars, the ASI provides a clearer picture of whether a breakout is sustainable or a potential fakeout.
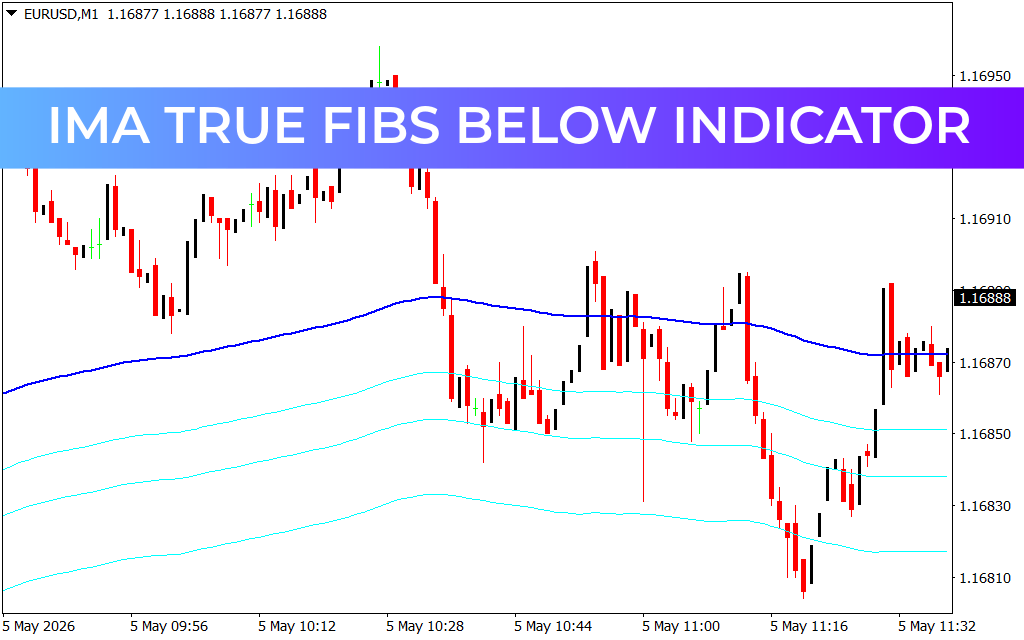
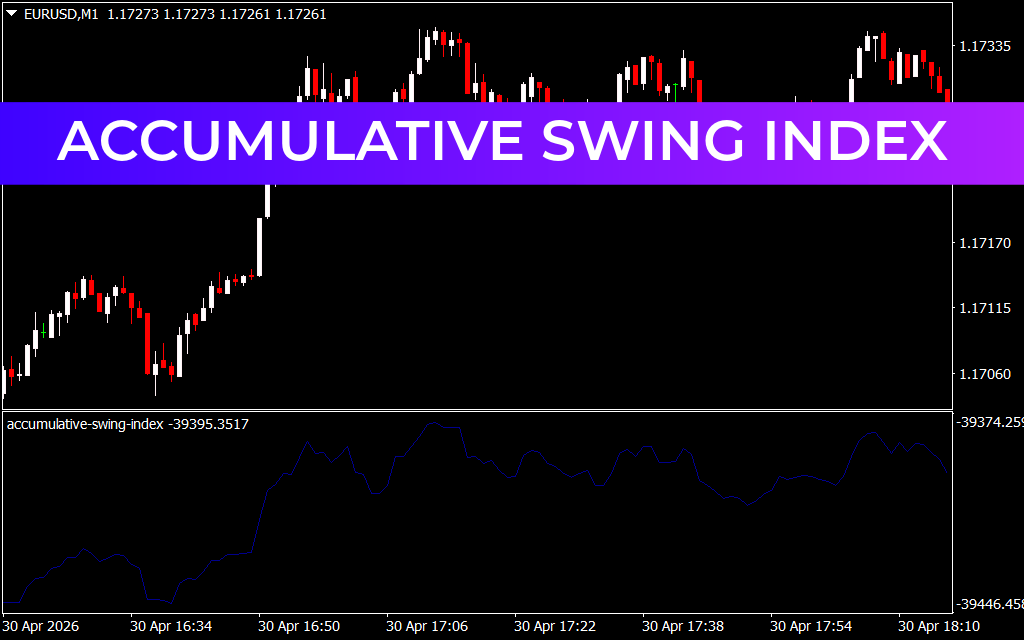
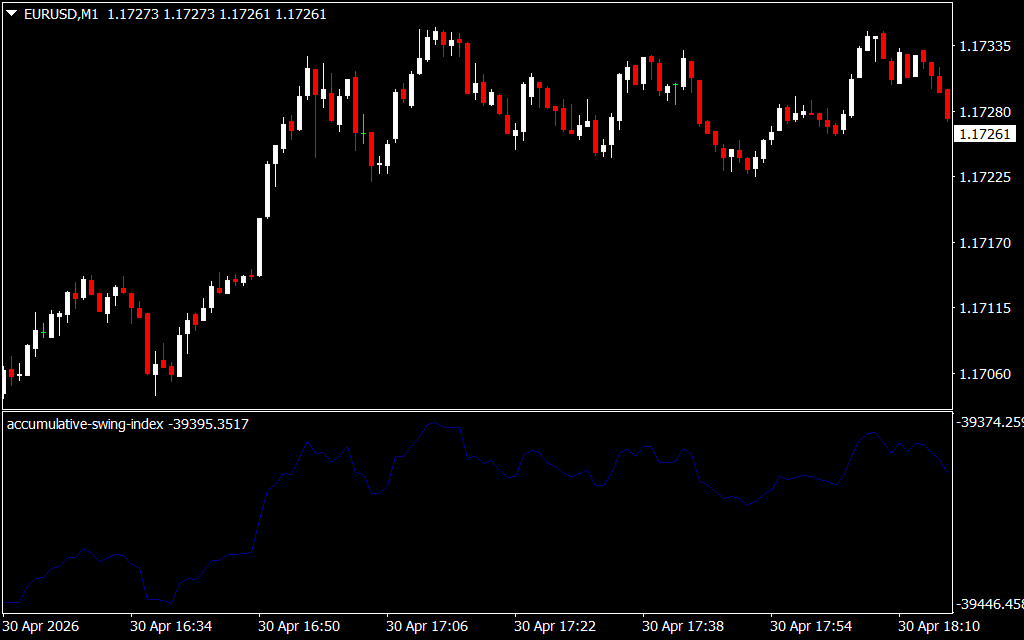
As seen in the provided chart, the indicator appears in a sub-window below the main price action. The blue line tracks the cumulative momentum, rising during sustained bullish swings and falling when bearish pressure dominates. Unlike standard oscillators that may lag, the ASI is designed to break its own trendlines or support/resistance levels ahead of the actual price, providing an early warning system for technical traders.
Key Benefits for Modern Traders
- Verified Trend Confirmation: Use the ASI to confirm trendline breakouts. If the price breaks a trendline but the ASI does not, it is often a sign of a weak move.
- Identification of Long-Term Swings: Because it is accumulative, the ASI is excellent at showing the macro-direction of the market, helping traders stay on the right side of the trend.
- Objective Market Peaks and Troughs: The indicator helps identify significant swing highs and lows that might be obscured by volatile candlestick wicks.
- Versatility Across Assets: Whether you are trading major pairs like EUR/USD or volatile commodities, the ASI adapts to the intrinsic "swing" of the specific asset.
Strategic Application
The most powerful way to use the Accumulative Swing Index is to look for Non-Confirmations and Divergences.
- Breakout Confirmation: When price moves above a significant resistance level, look at the ASI. If the indicator also breaks its corresponding resistance level, the breakout has a higher probability of success.
- Support And Resistance: Traders often draw trendlines directly on the ASI sub-window. A break in the ASI trendline often precedes a significant shift in price action on the main chart.
- Scalping and Day Trading: On lower timeframes like the M1 chart shown in the example, the ASI helps filter out the "jitter" of fast-moving markets, allowing for more disciplined entries.
Conclusion
The Accumulative Swing Index is a sophisticated addition to any technical analyst’s toolkit. By moving beyond simple price points and focusing on the relationship between all four price elements (OHLC), it provides a mathematically sound representation of market momentum. If you are looking to refine your entry timing and improve your trend-following accuracy, the ASI is an indispensable tool.
1 Download
Last Update:
Apr 30, 2026 23:06 PM
Published:
Jan 30, 2026 18:54 PM
Category: