Unlock Precision Timing: The Definitive Guide to the 3-10 Oscillator Indicator
In the high-stakes arena of financial trading, momentum is the engine that drives Price Action. For traders seeking to capture swings in volatility with surgical precision, the 3-10 Oscillator Indicator is a time-tested tool that bridges the gap between trend identification and entry timing. Often associated with the legendary Linda Raschke, this indicator is a variation of the MACD that provides a faster, more sensitive look at market momentum, making it a favorite for scalpers and swing traders alike.
What is the 3-10 Oscillator Indicator?
The 3-10 Oscillator is a dual-line momentum study that calculates the difference between two simple moving averages (SMAs). As the name suggests, it primarily utilizes a 3-period SMA and a 10-period SMA. By subtracting the slower average from the faster one, the indicator creates an oscillating line that moves above and below a zero point.
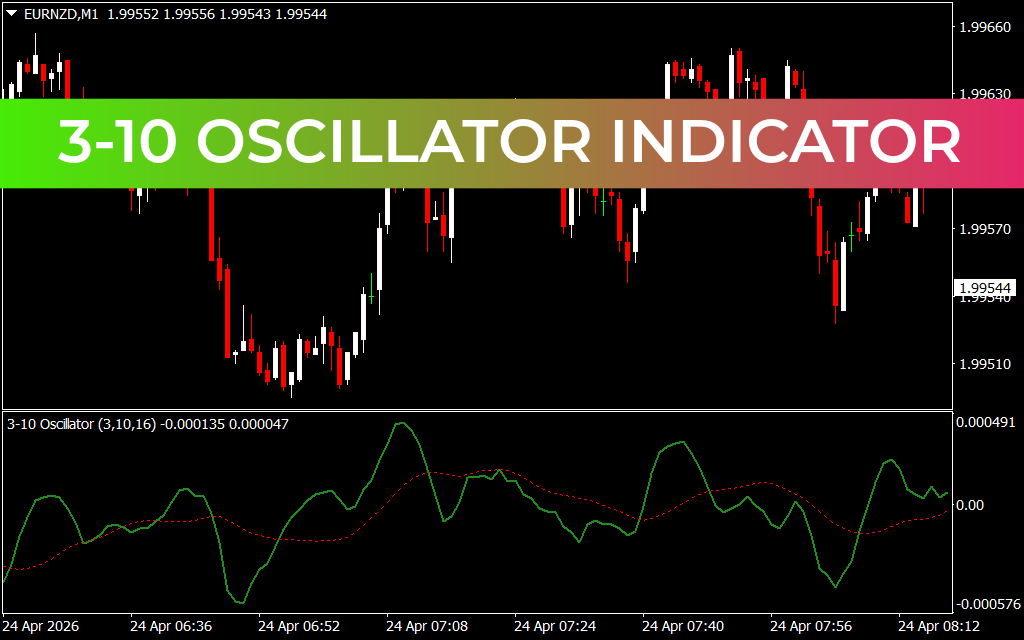
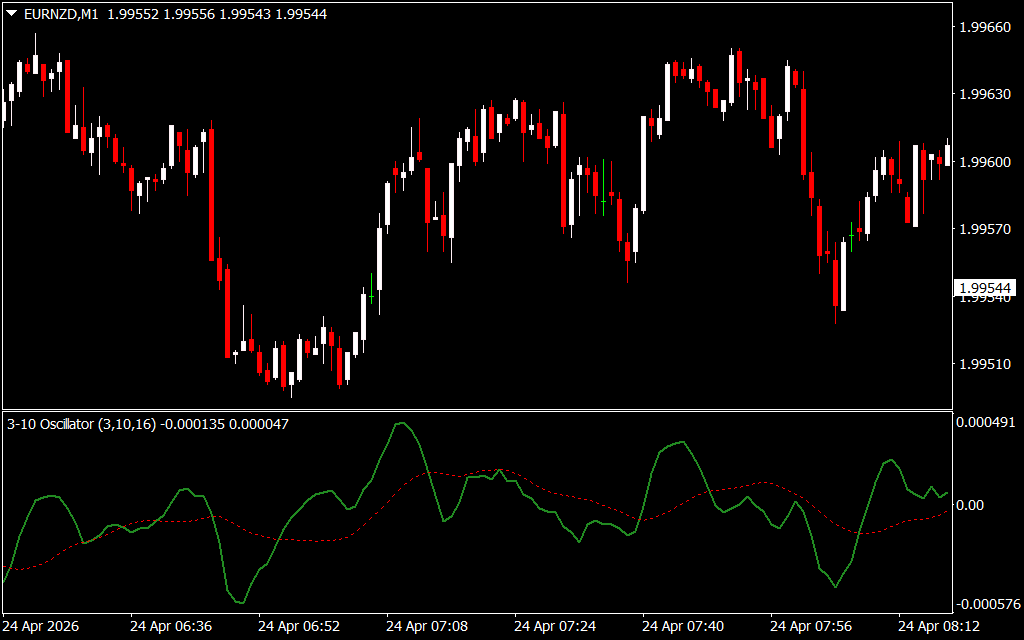
As shown in the EURNZD M1 chart, the indicator typically consists of:
- The Fast Line (Green): The actual 3-10 difference, representing immediate momentum.
- The Signal Line (Red/Dashed): A secondary moving average (often a 16-period SMA of the fast line) that helps smooth out the noise and identify trend shifts.
Why the 3-10 Oscillator Outperforms Standard Tools
While standard oscillators like the RSI or Stochastic can remain stuck in overbought or oversold zones during strong trends, the 3-10 Oscillator is designed to follow the rhythm of the market.
- Divergence Detection: The 3-10 is world-class at spotting divergences. If price makes a lower low but the oscillator makes a higher low, it signals that the downward momentum is drying up—often predicting a massive bullish reversal before it happens on the chart.
- Zero-Line Crossovers: The zero line acts as the "balance of power." When the green line crosses above zero, bulls are in control. When it drops below, bears have the upper hand.
- The "Anti" Pattern: This indicator is famous for identifying "slingshot" moves. When the fast line makes a deep retracement toward the signal line while the primary trend is still intact, it offers a high-probability entry point into the existing trend.
Strategic Trading Implementation
To get the most out of the 3-10 Oscillator, look for confluence. In the provided M1 chart, observe how the green fast line leads the price action, dipping deep into negative territory before the price bottoms out. The moment the fast line hooks upward and crosses the red signal line, it provides an early warning of the subsequent bullish recovery.
For day traders, this tool is invaluable for managing exits. When the gap between the green line and the red signal line starts to narrow significantly, it indicates that the current move is losing steam. This allows you to lock in profits while other traders are still waiting for a price reversal that hasn't materialized yet.
Whether you are navigating the micro-trends of the 1-minute chart or looking for structural shifts on the daily timeframes, the 3-10 Oscillator provides the mathematical clarity needed to trade with confidence.
Meta Description
3 Downloads
Last Update:
Apr 24, 2026 15:23 PM
Published:
Feb 03, 2026 12:23 PM
Category: