Master Trend Reversals with the Zigzag Fractals Pattern Indicator
In the fast-paced world of Forex trading, identifying the exact moment a trend exhausts itself is the "Holy Grail" for many investors. The Zigzag Fractals Pattern Indicator for MetaTrader is a powerful technical tool designed to strip away market noise and highlight the underlying structural skeleton of Price Action. By combining the classic Zigzag logic with Fractal theory, this indicator provides a clear, objective view of swing highs and swing lows, making it an indispensable asset for price action traders.
The Science of Market Structure
Market prices never move in a straight line; they move in waves. The primary challenge for traders is distinguishing between a minor retracement and a genuine Trend Reversal. The Zigzag Fractals Pattern Indicator solves this by:
- Connecting the Dots: It filters out small price fluctuations, drawing straight lines between significant peaks and troughs. This helps you visualize the "bones" of the market.
- Fractal Confirmation: By integrating Bill Williams’ Fractal geometry, the indicator identifies specific five-bar patterns where the market has reached a temporary ceiling or floor.
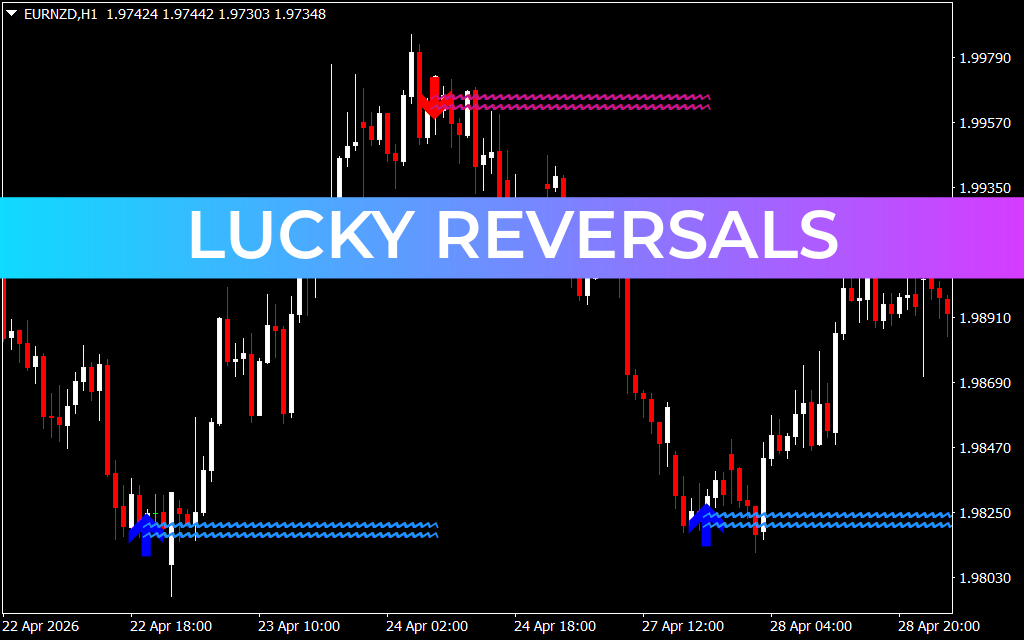
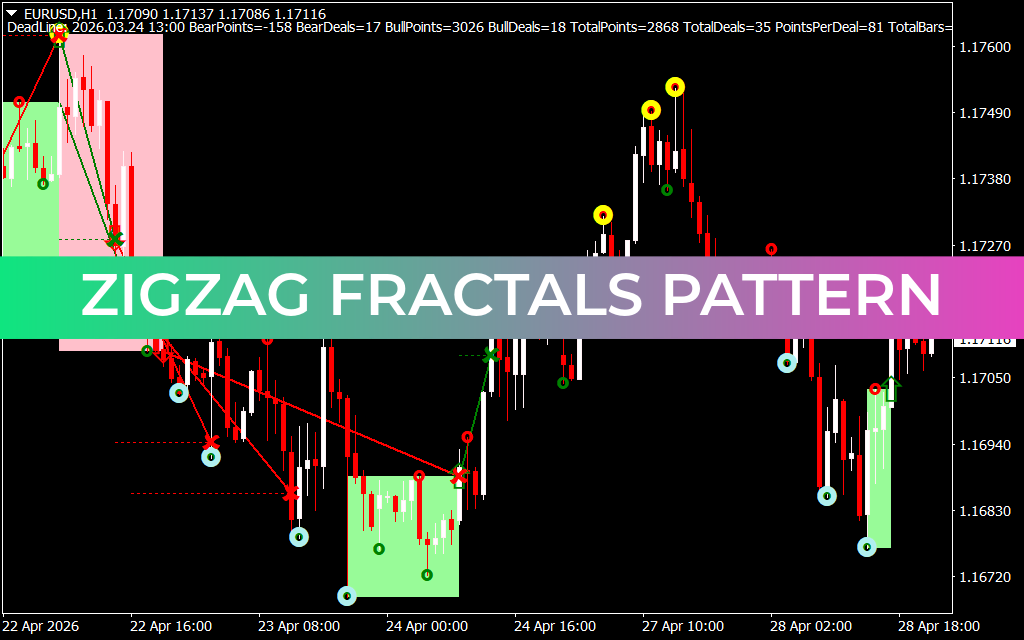
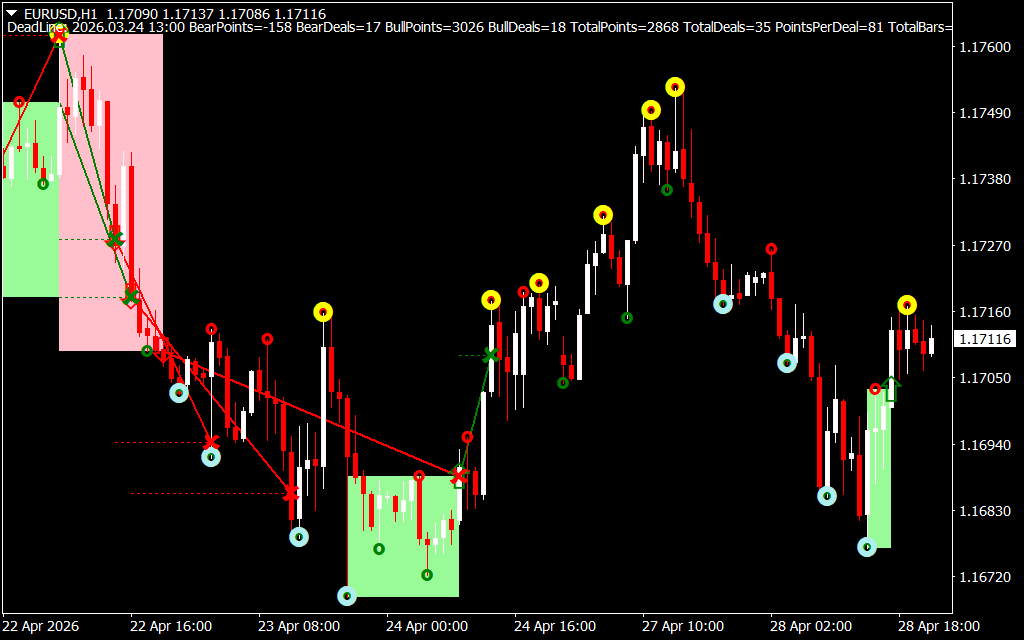
- Pattern Recognition: As seen in the EUR/USD H1 chart, the indicator uses color-coded zones—green for bullish expansion and red for bearish contraction—to show the "Dominant Leg" of the current move.
Precision Entries and Strategic Stop-Losses
One of the standout features of the Zigzag Fractals Pattern is its ability to identify Break of Structure (BOS). When the price moves past a previous Zigzag high or low (marked by the "X" and yellow circular icons), it signals a potential shift in market sentiment.
For many traders, the yellow icons act as a primary alert for trend exhaustion. When these appear at major support or resistance levels, they offer high-concurrency trade setups. Furthermore, the indicator provides a statistical dashboard at the top of the screen, tracking "BearPoints," "BullPoints," and "PointsPerDeal." This data allows you to backtest the effectiveness of the current volatility in real-time, ensuring your strategy is adapted to current market conditions.
Versatility Across All Assets
While it excels on the 1-hour (H1) timeframe for pairs like EUR/USD, the Zigzag Fractals Pattern is highly adaptive. Scalpers can use it on M1 or M5 charts to catch quick "ABC" corrections, while swing traders can apply it to Daily charts to identify long-term cycle turns. By eliminating the guesswork associated with manual trendline drawing, this indicator ensures that your technical analysis remains consistent, objective, and—most importantly—profitable.
14 Downloads
Last Update:
Apr 29, 2026 01:29 AM
Published:
Jan 31, 2026 19:09 PM
Category: