The Yesterday High Low Break Monitor Indicator for MT4 is a simple yet effective tool designed to measure the strength and direction of forex pairs using the previous day’s high, low, and break levels. It gives traders a quick visual overview of whether a currency pair is trending up, down, or moving sideways — helping them make informed trading decisions.
This indicator is perfect for traders who rely on Price Action and breakout trading strategies, such as the high-low breakout method. By identifying whether a pair is bullish, bearish, or neutral, traders can filter potential trades and focus only on pairs with strong momentum.
How the Yesterday High Low Break Monitor Indicator Works
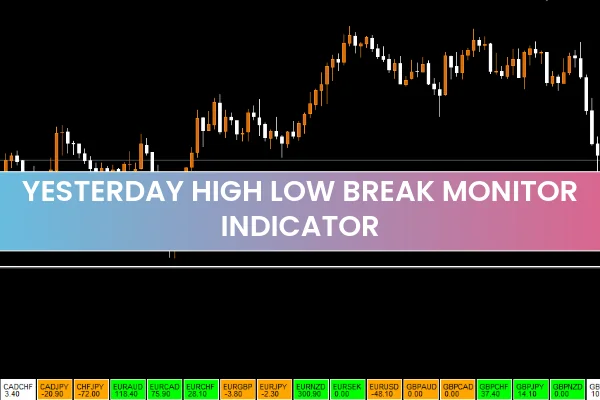
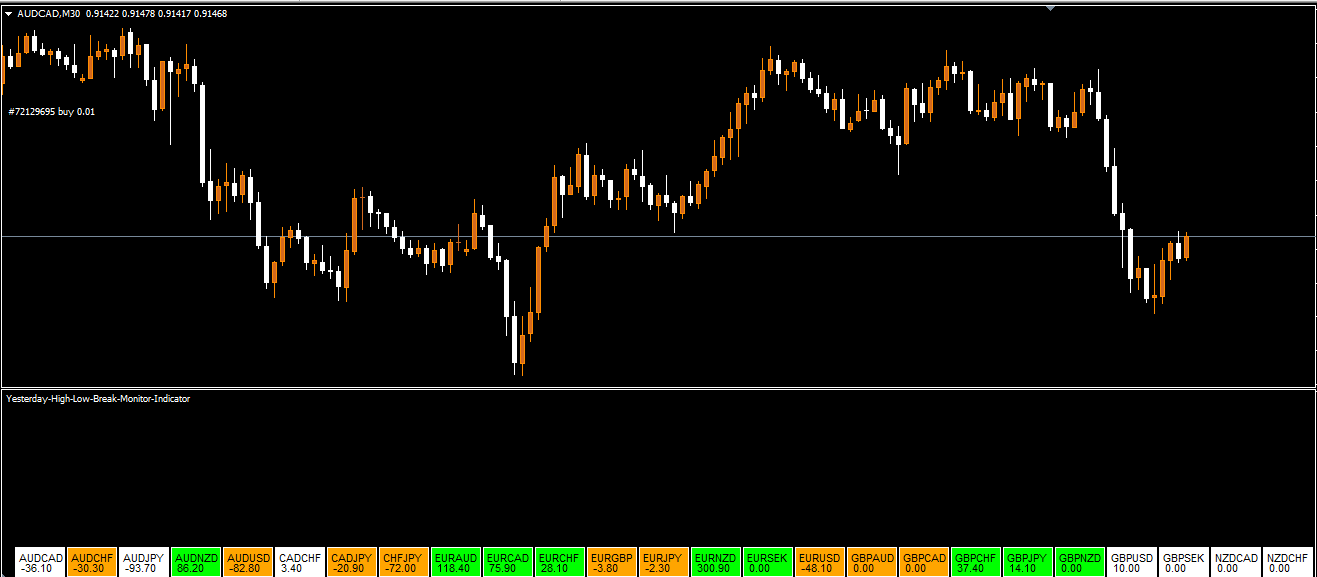
The indicator calculates yesterday’s highs, lows, and break points to determine the current market bias. Based on this analysis, it displays colored buttons for each currency pair at the bottom of the MT4 chart.
Here’s what each color represents:
Green Button: Indicates that the pair is trending upward or showing bullish strength.
Orange Button: Indicates bearish pressure or downward momentum.
White Button: Suggests a neutral or consolidating market condition.
Because of its multi-currency display, traders can instantly identify which pairs are performing best or weakest without switching charts — making it a convenient market monitoring dashboard.
Using the Indicator for Trend Confirmation
The Yesterday High Low Break Monitor Indicator does not generate direct buy or sell signals. Instead, it serves as a trend strength filter that helps traders confirm market direction before entering trades.
Traders can combine it with:
Support And Resistance Levels
Donchian Channels
Moving Averages
Breakout strategies
For example, if the indicator shows a green button (bullish trend), traders can look for buying opportunities near support levels or after a resistance breakout. Conversely, if the button is orange (bearish trend), traders should consider short positions when prices break below key support zones.
How to Trade the High-Low Breakout Strategy with This Indicator
The High-Low Breakout Strategy is one of the most popular methods that pairs perfectly with this indicator. Here’s how to apply it:
Identify the Trend:
Use the indicator to determine whether the currency pair is bullish (green) or bearish (orange).
Mark Support and Resistance:
Draw horizontal lines on the chart at the previous day’s high and low levels. These represent critical breakout points.
Wait for a Breakout:
In an uptrend (green), look for a break above resistance to enter long trades.
In a downtrend (orange), look for a break below support to enter short trades.
Set Stop Loss and Take Profit:
Place stop losses just below/above the breakout zone, and set take profit targets using recent swing points or risk/reward ratios.
This combination allows traders to follow the dominant market direction while avoiding trades against the trend.
Key Benefits
Easy-to-use visual interface with real-time strength display.
Works on all timeframes, from M1 to D1.
Supports multiple forex pairs simultaneously.
Great for trend confirmation and breakout strategy integration.
Completely free download on IndicatorForest.com.
The indicator simplifies trend monitoring and improves decision-making by clearly displaying which pairs are strong or weak — saving traders time and effort.
Conclusion
The Yesterday High Low Break Monitor Indicator for MT4 is a reliable tool for traders seeking quick insights into market strength and direction. By analyzing yesterday’s highs, lows, and break levels, it identifies whether pairs are trending, consolidating, or reversing.
Use it alongside the high-low breakout strategy or other technical tools to confirm trade setups and improve accuracy.
Download the Yesterday High Low Break Monitor Indicator for free from IndicatorForest.com and start monitoring forex pair strength more efficiently today.
FAQ
2 Downloads
Published:
Nov 06, 2025 14:21 PM
Category: