Precision Momentum Scalping with the X10 RSI Trading System
In the fast-paced world of Forex trading, the Relative Strength Index (RSI) has long been a favorite among technical analysts for its ability to spot overbought and oversold conditions. However, standard RSI can often be prone to "noise," leading traders into premature entries. The X10 RSI Trading System is a high-performance evolution of this classic oscillator, specifically engineered to provide cleaner signals and enhanced trend-following capabilities for the modern day trader.
The Evolution of RSI Momentum
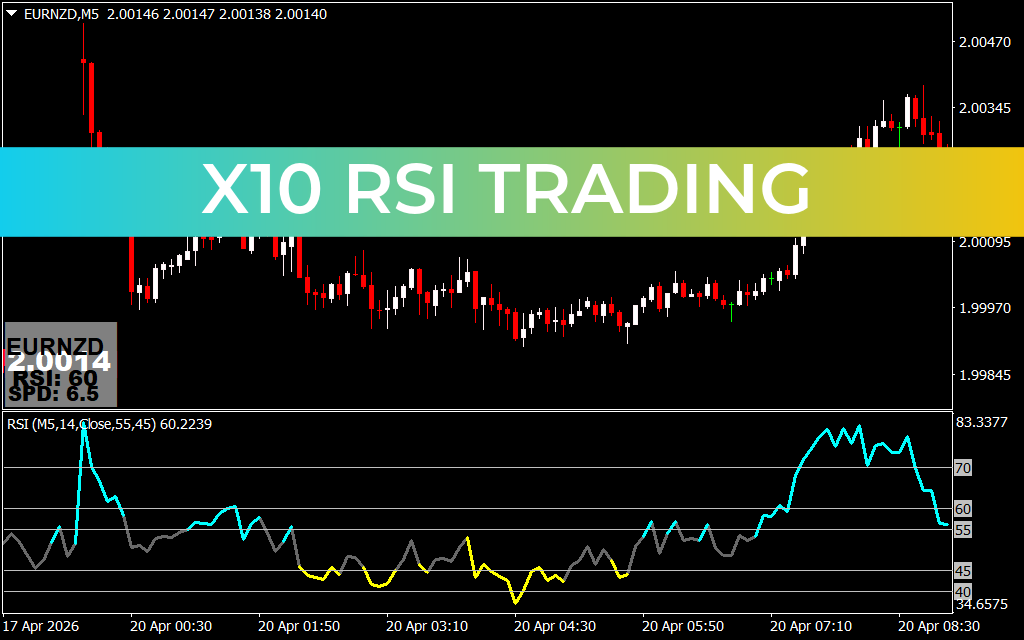
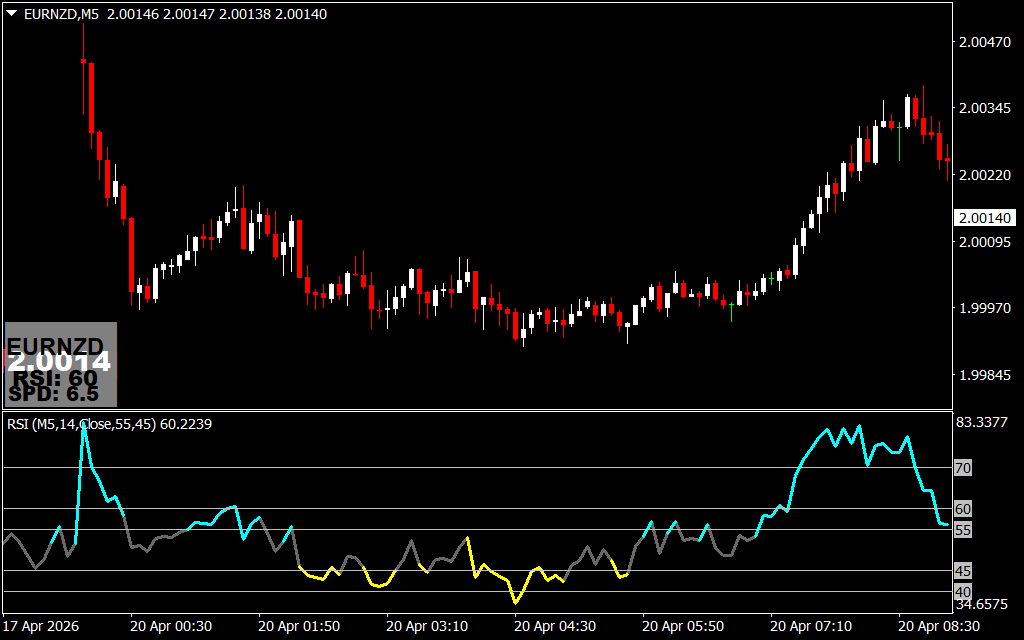
Traditional RSI calculations can struggle in high-volatility pairs like EURNZD, where price often stays "overbought" or "oversold" for extended periods during a strong trend. The X10 RSI addresses this by applying advanced smoothing algorithms and a multi-zone color-coding system. As shown on the EURNZD M5 chart, the indicator transforms a simple line into a comprehensive trend-tracking dashboard.
The system utilizes a unique color-shifting logic to guide your bias:
- Cyan Momentum: When the RSI line turns cyan and stays above the 55–60 levels, it indicates a powerful bullish expansion. This is the "high-probability zone" for long entries.
- Yellow/Gray Zones: These colors signify consolidation or a loss of momentum. By staying out of the market when the RSI is gray, traders can avoid the "choppy" Price Action that often leads to avoidable losses.
- Strategic Level Overlays: Unlike basic oscillators, the X10 RSI includes specific levels like 40, 45, 55, and 60. These act as "trigger zones" rather than static boundaries, helping traders identify the exact moment a trend is gaining or losing institutional support.
Strategic Execution on the M5 Chart
For scalpers operating on the 5-minute (M5) timeframe, timing is everything. The X10 RSI Trading System excels here by providing a visual "speedometer" of price movement. When the RSI line breaks above the 60 level and turns bright cyan, it signals a high-velocity move is underway. Conversely, a break below 40 accompanied by yellow shading warns that the bears have taken control.
Key advantages for MetaTrader users include:
- Trend Strength Identification: Instantly see if a trend has "legs" or if it is likely to fizzle out.
- Clear Exit Signals: The color change back to gray serves as an objective signal to lock in profits before a reversal occurs.
- Reduced Lag: The X10 algorithm is optimized to react faster to price shifts than standard lagging indicators, providing a surgical edge in volatile markets.
Why Every Trader Needs the X10 Advantage
The ultimate goal of the X10 RSI Trading System is to simplify the trading process. By providing a clear, color-coded roadmap of momentum, it removes the emotional guesswork often associated with technical analysis. Whether you are a beginner looking for a reliable strategy or a professional seeking to refine your entries, the X10 RSI offers the precision and clarity needed to succeed.
By integrating this system into your trading arsenal, you aren't just following price—you are anticipating momentum. It allows you to visualize the strength of the market participants, ensuring you stay aligned with the "big money" moves for consistent, long-term success.
1 Download
Last Update:
Apr 20, 2026 21:41 PM
Published:
Feb 03, 2026 16:42 PM
Category: