Master Market Momentum with the WCCI FIBO RSI Indicator
The search for the "perfect" entry often leads traders to clutter their charts with conflicting tools. The WCCI FIBO RSI Indicator for MetaTrader 4 solves this by synthesizing three powerful trading concepts into a single, high-performance oscillator. By combining the trend-following capabilities of Woodies CCI with the precision of Fibonacci levels and the momentum tracking of the Relative Strength Index (RSI), this tool provides a comprehensive map of market sentiment.
A Triple-Threat Approach to Technical Analysis
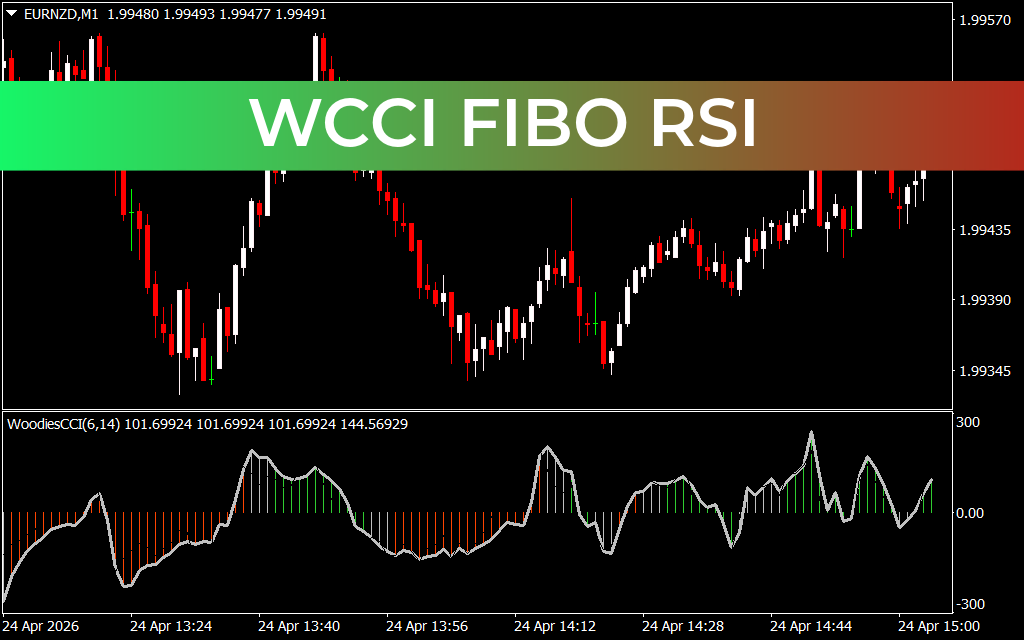
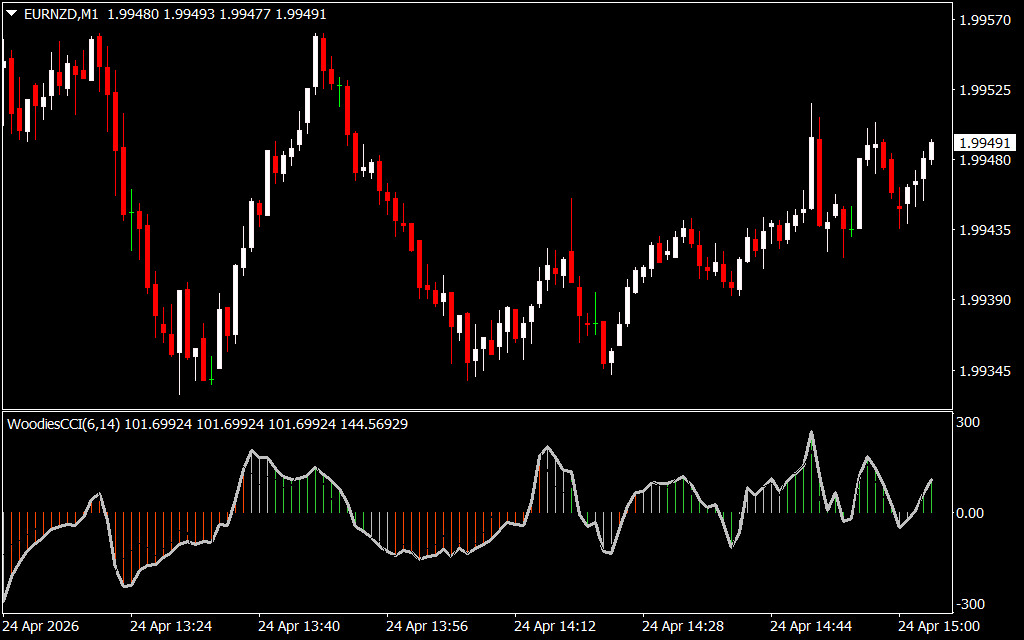
In the fast-moving EURNZD M1 environment, identifying the exact moment momentum shifts is critical. The WCCI FIBO RSI excels at this by providing a multi-layered histogram that visualizes the strength of the current move relative to historical volatility.
- Woodies CCI Logic: The core of the indicator utilizes the Commodity Channel Index (CCI) formula to identify cyclical trends. The zero-line acts as the "equator" of the market—trading above it suggests bullish dominance, while trading below indicates bearish control.
- Fibonacci Integration: Unlike standard oscillators, the vertical bars are scaled based on Fibonacci ratios. This helps traders identify overextended conditions (Overbought/Oversold) with much greater mathematical accuracy than fixed levels.
- RSI Smoothing: The gray signal line acts as an RSI filter, smoothing out erratic price spikes to show the true direction of the trend. When the histogram bars and the signal line align, you have a high-probability trade setup.
Precision Scalping on the M1 Timeframe
As seen in the recent Price Action for EURNZD, the market frequently transitions from sharp sell-offs to aggressive rallies. Around 13:24, the WCCI FIBO RSI plummeted toward the -300 level, signaling an extreme oversold condition. Almost immediately, the green histogram bars began to emerge, providing a lead signal for the subsequent recovery toward the 1.99570 level.
The color-coded histogram (red for bearish, green for bullish) provides instant visual feedback. This is essential for M1 scalpers who don't have the luxury of time to analyze multiple lagging indicators. By watching for the "Zero Line Reject" or the "Extreme Hook," traders can anticipate reversals before they appear on the main price chart.
Why Trade with WCCI FIBO RSI?
The primary advantage of this indicator is convergence. When three different mathematical models agree on a direction, the probability of a successful trade increases exponentially. It effectively filters out the "market noise" that often plagues lower timeframes, allowing you to focus on high-conviction setups.
Whether you are a professional scalper or a retail trader looking to refine your entries, the WCCI FIBO RSI provides a professional-grade edge. It is designed to be intuitive enough for beginners while offering the depth of data required by veteran technical analysts. Transform your MetaTrader experience and start trading with a synthesized view of momentum, volatility, and trend.
2 Downloads
Last Update:
Apr 24, 2026 18:06 PM
Published:
Feb 03, 2026 02:01 AM
Category: