Maximize Trading Accuracy with the RSI Stochastic WPR Indicator
In the competitive world of Forex and CFD trading, relying on a single indicator can often lead to "analysis paralysis" or, worse, false signals. The RSI Stochastic WPR Indicator is a high-performance technical solution for MetaTrader platforms that solves this problem by synthesizing three of the most powerful oscillators in financial history into one cohesive visual interface. By combining the Relative Strength Index (RSI), the Stochastic Oscillator, and Williams’ Percent Range (WPR), this tool provides a triple-filter approach to market momentum and trend exhaustion.
The Synergy of Three Legendary Oscillators
Individually, these indicators are staples on professional trading desks. Together, they create a comprehensive map of market sentiment:
- Relative Strength Index (RSI): Measures the speed and change of price movements to identify overbought or oversold conditions based on recent gains versus losses.
- Stochastic Oscillator: Compares a specific closing price of an asset to a range of its prices over a certain period, highlighting the momentum of the market.
- Williams’ Percent Range (WPR): A dynamic Momentum Indicator that excels at spotting "swing highs" and "swing lows," often acting as an early warning system for price reversals.
Visual Precision for Smarter Entries
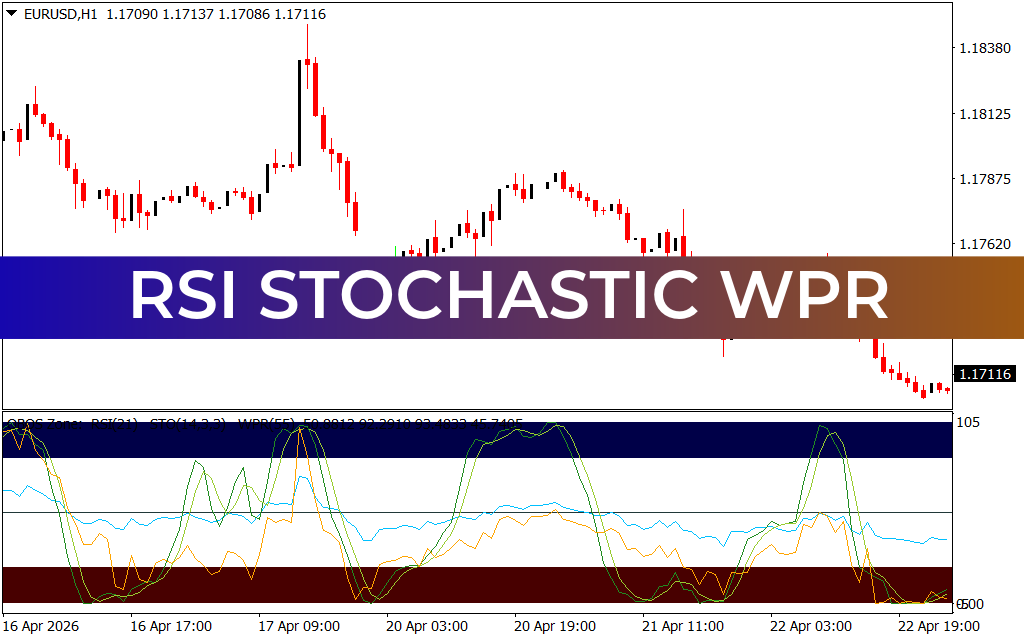
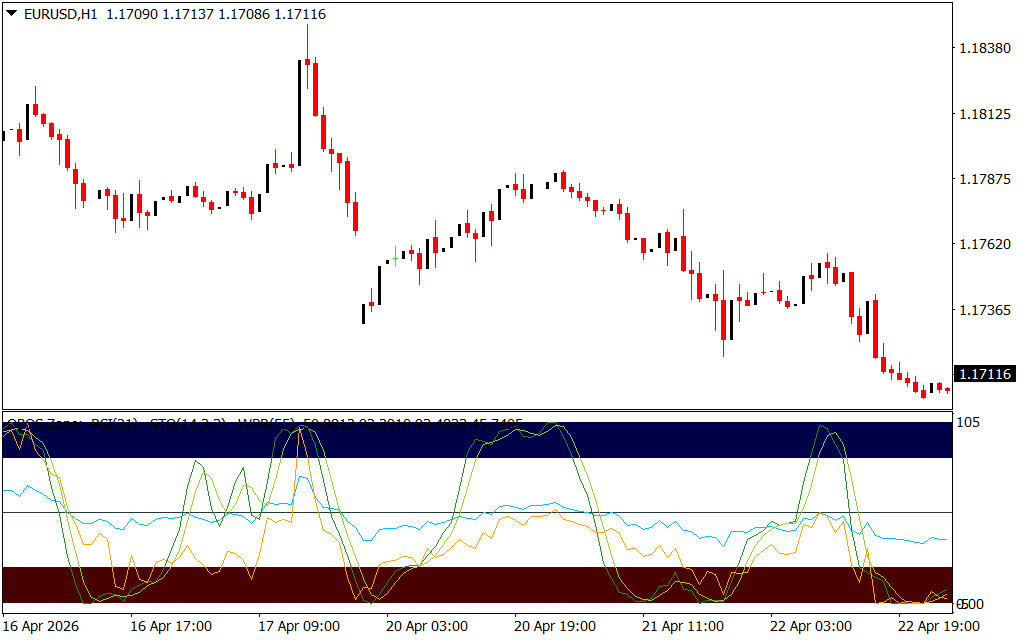
As seen in the EUR/USD H1 chart, the RSI Stochastic WPR Indicator simplifies complex data. It features distinct "OBOS" (Overbought/Oversold) zones, typically represented by shaded bands at the top and bottom of the indicator window.
When the lines converge within the upper dark blue band, the market is heavily overextended to the upside, suggesting a high-probability shorting opportunity. Conversely, when the lines dip into the lower dark red zone, the selling pressure is likely exhausted, signaling a potential bullish reversal. This visual "confluence" ensures that you only take trades when all three oscillators agree, significantly reducing the likelihood of getting caught in a "fakeout."
Optimization and Strategy
Whether you are a scalper looking for quick entries on the 5-minute chart or a swing trader analyzing the H1 and H4 timeframes, the RSI Stochastic WPR is fully customizable. Traders can adjust the periods for each component to match their specific risk profile.
A popular strategy involves waiting for the Stochastic lines to cross while the RSI and WPR are both exiting an extreme zone. This "momentum breakout" confirms that the price has not only reached an extreme but has actually begun the turn back toward the mean. By integrating this indicator into your setup, you gain a professional-grade filter that separates genuine market shifts from temporary noise, allowing for tighter stops and more profitable targets.
4 Downloads
Last Update:
Apr 29, 2026 01:26 AM
Published:
Jan 31, 2026 19:12 PM
Category: