Master Market Volatility with the Band Moving Average Indicator
In the competitive landscape of Forex trading, identifying the core trend is only half the battle. To truly succeed, a trader must understand where price is likely to overextend and where it is likely to find support. The Band Moving Average indicator is a sophisticated technical tool designed to provide this dual perspective, offering a clear visual map of price boundaries and Trend Strength simultaneously.
What is the Band Moving Average?
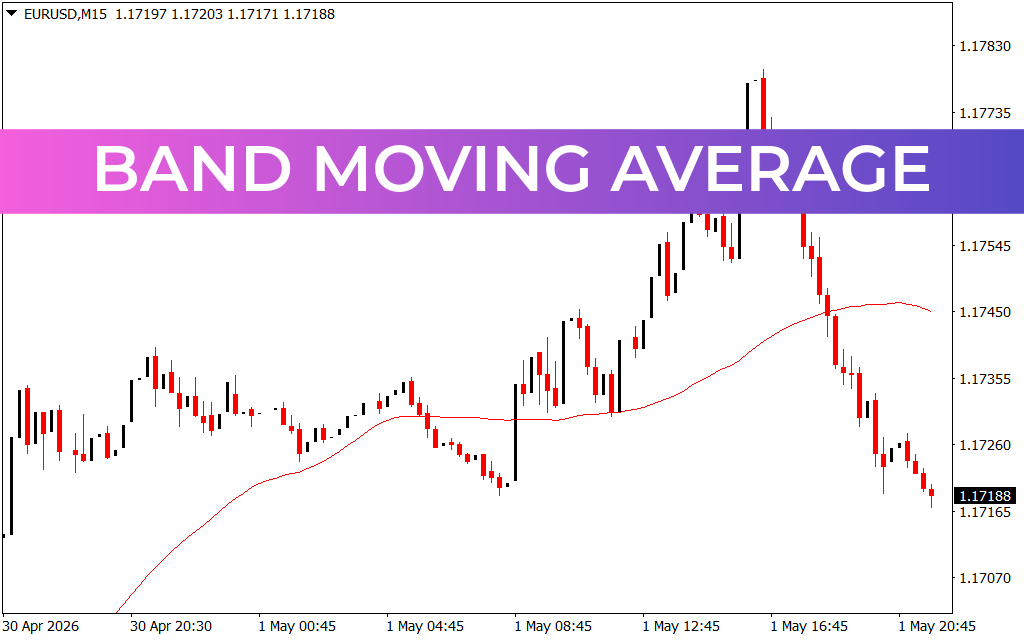
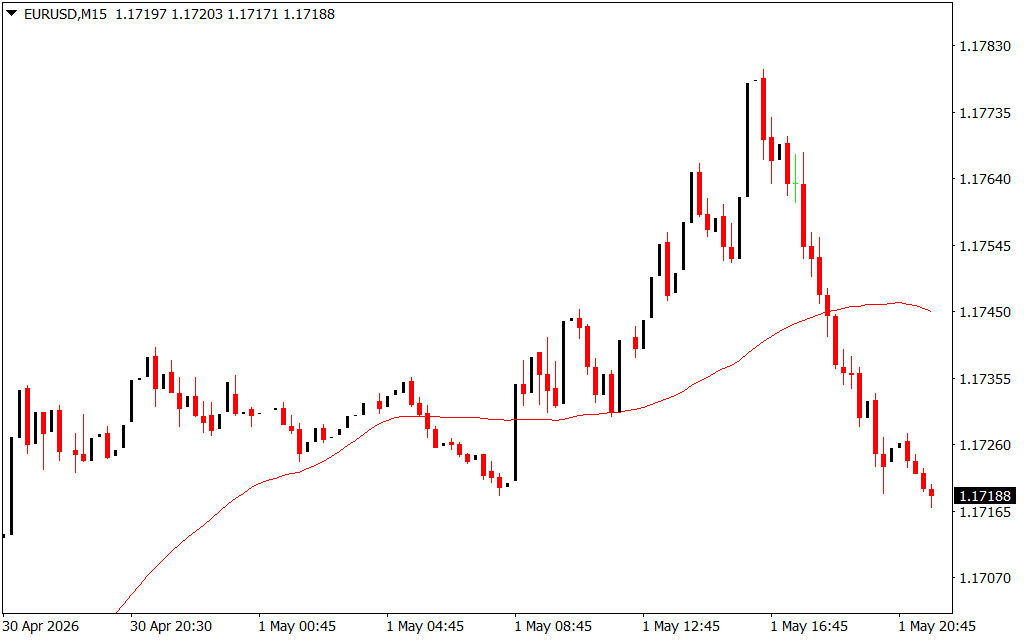
Unlike a single moving average line that simply tracks the average price over time, the Band Moving Average creates a dynamic "channel" around Price Action. It typically consists of a central median line (the moving average) and two outer bands calculated based on a specific deviation or volatility factor.
As seen on the EUR/USD M15 chart, these bands act as elastic boundaries. When price action remains within the bands, the market is in a state of equilibrium. However, when price pushes against or breaks through the outer edges, it signals high-momentum moves or potential overbought/oversold conditions.
Why Traders Prefer Moving Average Bands
The Band Moving Average is a favorite among day traders and swing traders because it transforms a flat chart into a three-dimensional field of play.
- Visualizing Volatility: The width of the bands automatically adjusts to market conditions. In quiet markets, the bands contract; during high-impact news events or trend breakouts, they expand. This gives you an immediate "weather report" of market volatility.
- Dynamic Support And Resistance: Traditional horizontal levels are static, but the market is fluid. Band Moving Averages provide "floating" support and resistance levels that move with the price, offering more accurate entry and exit points.
- Trend Confirmation: A strong trend is often characterized by price "walking the bands." If price consistently stays between the median line and the upper band, you are in a healthy uptrend. If it falls below the median, the trend may be weakening.
Strategic Implementation
To maximize the effectiveness of the Band Moving Average, it is best used as part of a comprehensive trading system:
- The Mean Reversion Strategy: When price touches the outer band and shows a reversal candlestick pattern (like a pin bar or engulfing candle), traders often look for a "reversion to the mean"—expecting price to travel back toward the center moving average.
- The Breakout Strategy: A definitive candle close outside of the bands can signal the start of a massive trend expansion. This is the moment trend followers wait for to capture large pips.
- Timeframe Synergy: Use the M15 chart to find entries that align with the trend on the H1 or H4 charts. When the bands on both timeframes point in the same direction, the probability of success skyrockets.
By incorporating the Band Moving Average into your trading routine, you replace guesswork with a structured, mathematical framework. It allows you to see not just where the price is, but where it is going and where it is likely to stop.
1 Download
Last Update:
May 02, 2026 13:36 PM
Published:
Jan 29, 2026 18:03 PM
Category: