The Wave Trend Oscillator indicator for MetaTrader is a powerful forex technical tool designed to track and follow market trends. It oscillates as price moves between different levels on the chart, helping traders visualize momentum shifts with ease.
This indicator monitors diminishing price momentum to detect potential trend reversals. Thanks to its built-in smoothing effect, it reacts efficiently to price changes and produces clearer crossover signals.
A key feature of the Wave Trend Oscillator is its exhaustion terminals, commonly known as overbought and oversold zones. These areas highlight where price is most likely to reverse, helping traders anticipate potential trade setups as price approaches these extreme levels.
The versatile design of the Wave Trend Oscillator makes it suitable for Scalping, day trading, and swing trading. Both beginners and experienced traders will find it useful for identifying important market turning points.
Another advantage is its ability to highlight divergence setups, since it is displayed in a separate indicator window. This allows you to spot when price moves in the opposite direction of the oscillator—an early warning of a possible reversal.
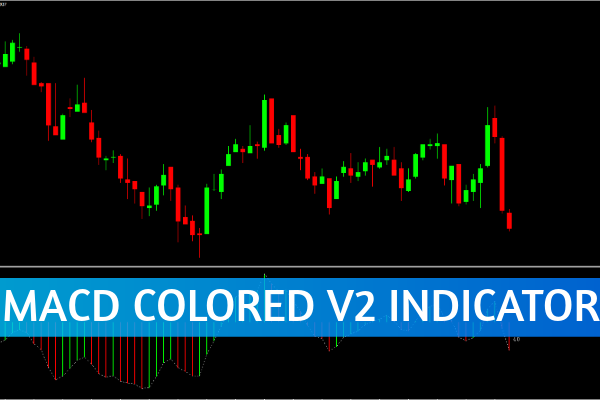
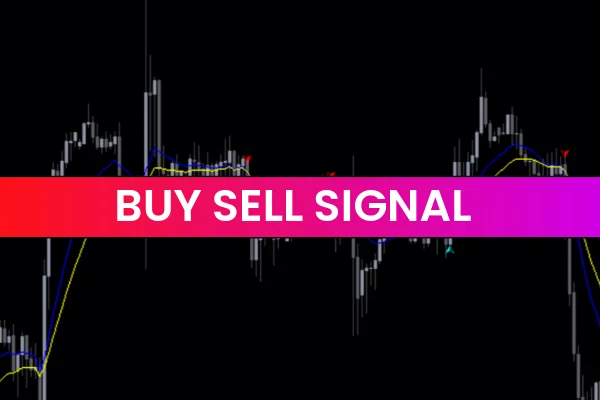
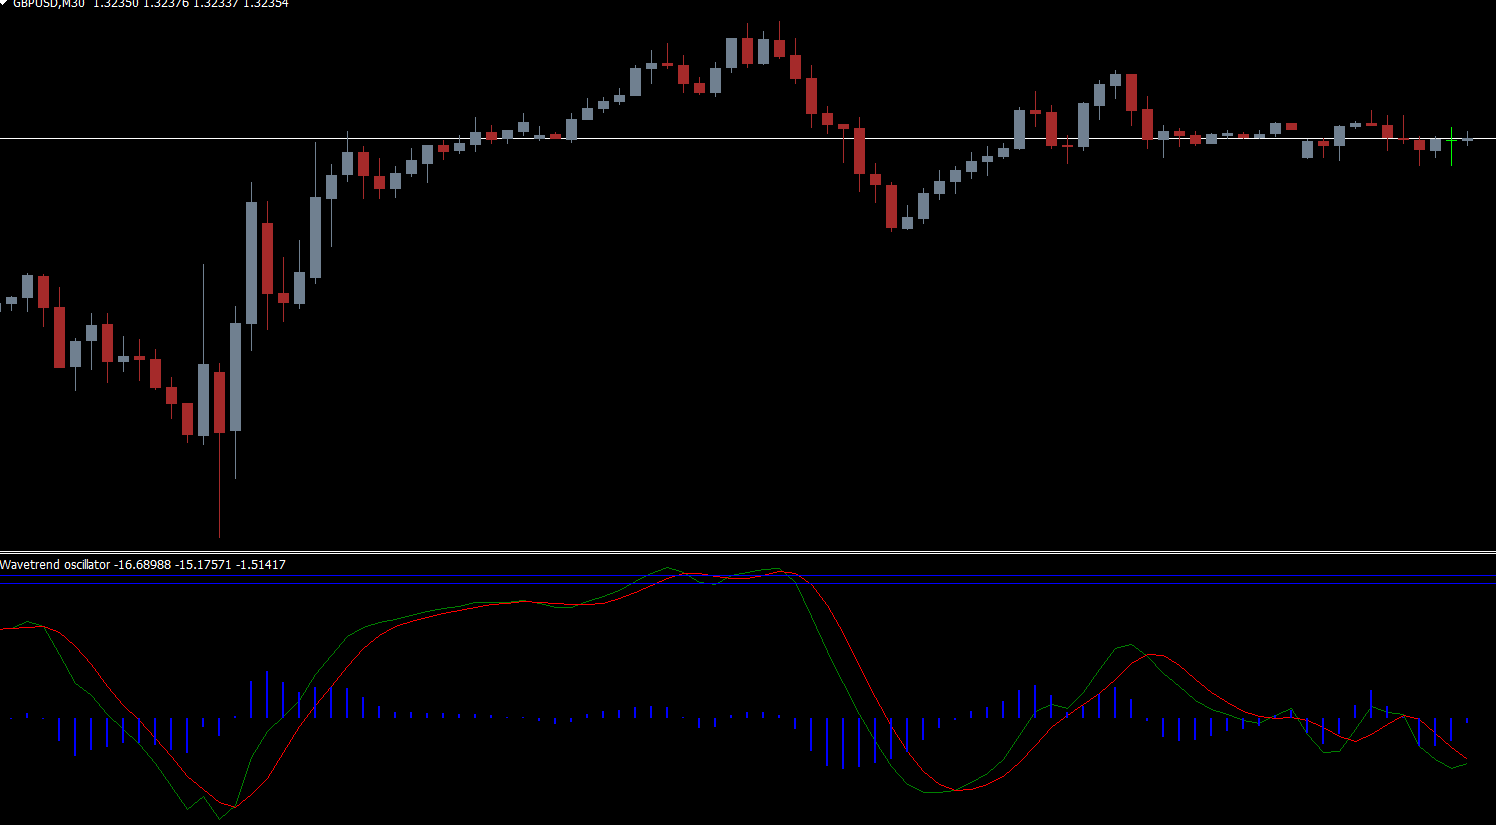
Wave Trend Oscillator Indicator BUY/SELL Signals
In the example chart, the Wave Trend Oscillator shows the EUR/USD Price Action with two key regions: overbought and oversold. These zones help determine market extremes.
The indicator generates BUY and SELL signals when its lines cross. Although these signals appear on all timeframes, they tend to be more reliable on higher timeframes—especially when price reaches extreme zones.
However, not all crosses should be traded. Like any technical tool, the Wave Trend Oscillator is not 100% accurate. For best results, use it together with price action, support/resistance levels, or other confirming indicators. This improves the probability of catching strong moves instead of false signals.
To identify a high-probability BUY setup, wait for the oscillator to touch or enter the oversold zone. A BUY/LONG can be considered after the indicator crosses back upward and price forms a bullish reversal candlestick.
For example, the BUY setup becomes valid once a bullish engulfing pattern appears at the oversold terminal. This often leads to a strong upward move before price shifts again.
A SELL setup forms in the same way. After the oscillator reaches the overbought zone, a bearish reversal pattern—such as a bearish engulfing candle—confirms the SELL signal.
Always remember to use proper Stop Loss and Take Profit levels. They should be realistic and placed at logical market points to protect your trades.
Conclusion
The Wave Trend Oscillator indicator for MT4 is a valuable tool for identifying strategic turning points in the market with improved accuracy. It enhances your trading decisions by combining trend-following momentum signals, reversal detection, and divergence setups. Add it to your MT4 chart for a smoother and more informed trading experience. Best of all, it is available free to download.
FAQ
4 Downloads
Published:
Nov 27, 2025 22:05 PM
Category: