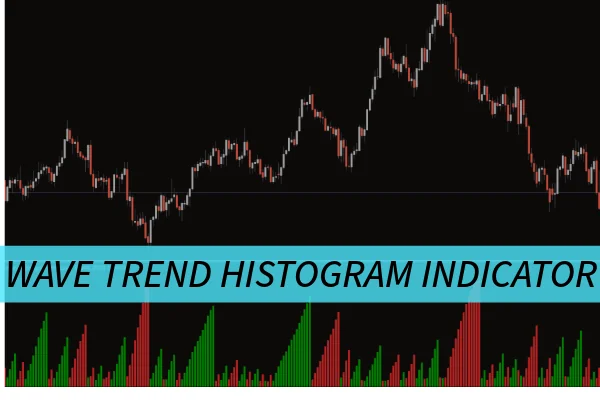
The Wave Trend Histogram Indicator for MetaTrader 4 is a powerful tool for traders who seek clarity in market momentum and trend direction. By visually displaying bullish and bearish movements through a dynamic histogram, this indicator simplifies complex technical analysis into an easy-to-read format. Whether you’re new to trading or an experienced professional, the Wave Trend Histogram Indicator empowers you to recognize early trend reversals, confirm entries, and enhance your trading precision.
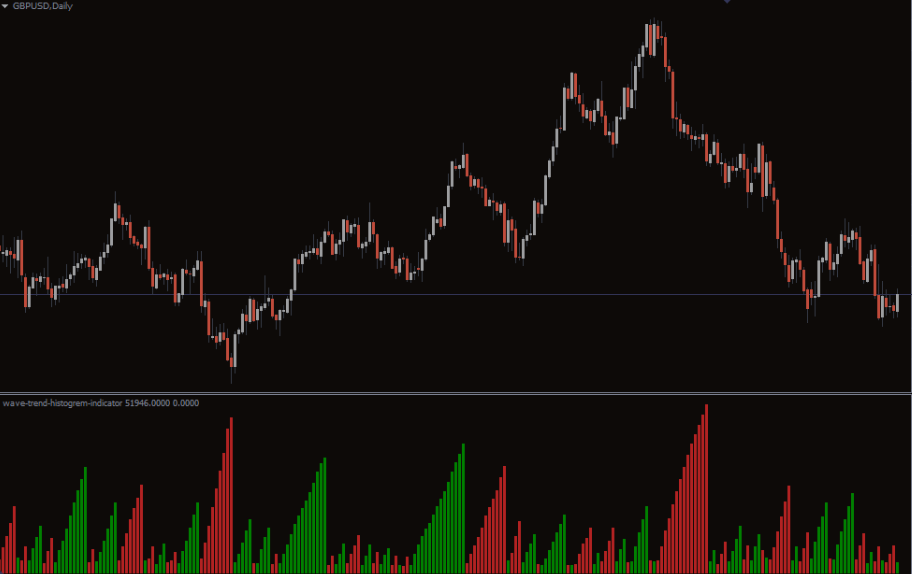
At its core, the Wave Trend Histogram Indicator transforms raw market data into an intuitive visual form. The histogram bars oscillate above and below a zero line, representing bullish and bearish pressure within the market.
Green bars above zero → indicate bullish momentum and potential upward price movement.
Red bars below zero → signal bearish momentum and possible downtrends.
The strength and height of the bars reflect momentum intensity. Stronger (taller) bars typically suggest robust price movements, while shrinking bars may signal consolidation or weakening trends. This structure allows traders to quickly interpret market sentiment and respond before major price shifts occur.
The Wave Trend Histogram Indicator provides clear and timely trading signals. When bars turn from red to green above the zero line, traders may interpret it as a buy signal—indicating an emerging bullish trend. Conversely, when bars switch from green to red and fall below zero, it can be a sell signal, suggesting a possible downward reversal.
These transitions are particularly useful when combined with other indicators such as:
Moving Averages – for confirming long-term trends
Support and Resistance Levels – to validate breakout or reversal points
RSI or MACD – for measuring overbought and oversold conditions
By combining the Wave Trend Histogram with these complementary tools, traders can develop a more accurate and confident trading strategy.
Visual Clarity: The histogram format simplifies complex data, making it ideal for traders who prefer quick visual confirmations.
Early Reversal Detection: It helps identify potential turning points before they become obvious to the broader market.
Versatility: Suitable for various trading styles—scalping, swing trading, and long-term investing.
Customizable: Traders can adjust settings to match their preferred timeframes or instruments, such as forex, stocks, or commodities.
Ease of Use: Seamlessly integrates into the MetaTrader 4 (MT4) platform without requiring advanced setup.
The Wave Trend Histogram Indicator ultimately allows traders to interpret price momentum intuitively and make informed trading decisions.
Combine with Price Action: Confirm histogram signals with candlestick formations or support/resistance zones.
Avoid Overtrading: Wait for clear histogram color transitions before entering trades.
Use Stop-Loss Orders: Manage risk effectively by placing stop-losses just beyond recent swing highs or lows.
Backtest Strategies: Always test the indicator on historical data to find optimal settings for your specific asset class.
By applying these techniques, traders can maximize profits and reduce risk when using the Wave Trend Histogram Indicator.
The Wave Trend Histogram Indicator for MetaTrader 4 is more than just a momentum tool—it’s a complete trend analysis solution. Its clear visual representation helps traders understand market sentiment, confirm reversals, and execute trades with greater confidence.
Enhance your strategy today by downloading the Wave Trend Histogram Indicator from IndicatorForest.com and take your trading analysis to the next level.
Published:
Oct 14, 2025 03:50 AM
Category: