Mastering Volatility-Based Stops: The WATR Indicator for MT4 and MT5
In technical trading, finding the perfect level to place your stop-loss is one of the most difficult challenges you will face. Place it too close to your entry, and the normal noise of daily Price Action will stop you out prematurely. Place it too far away, and you expose your account to excessive risk. To eliminate this guesswork, professional traders rely on volatility-based tools rather than fixed-pip structures. The WATR indicator for MT4 and MT5 stands out as a premier technical utility designed to track market volatility and provide dynamic, automated stop-loss and trailing take-profit baselines.
WATR—which typically represents a variation of the Weighted Average True Range or Wave Average True Range—measures the expanding and contracting volatility of an asset over a set period. By calculating the real-time true range of price delivery, it tracks exactly how much an asset like the EUR/USD is breathing, giving you an objective structure to manage your risk.
Decoding the Dynamic Levels of the WATR Indicator
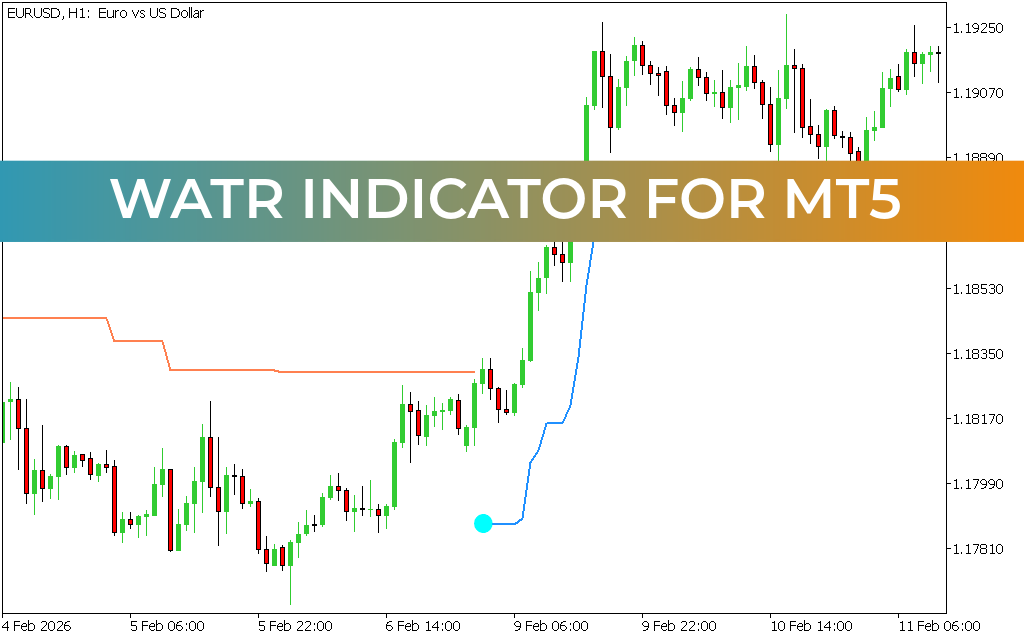
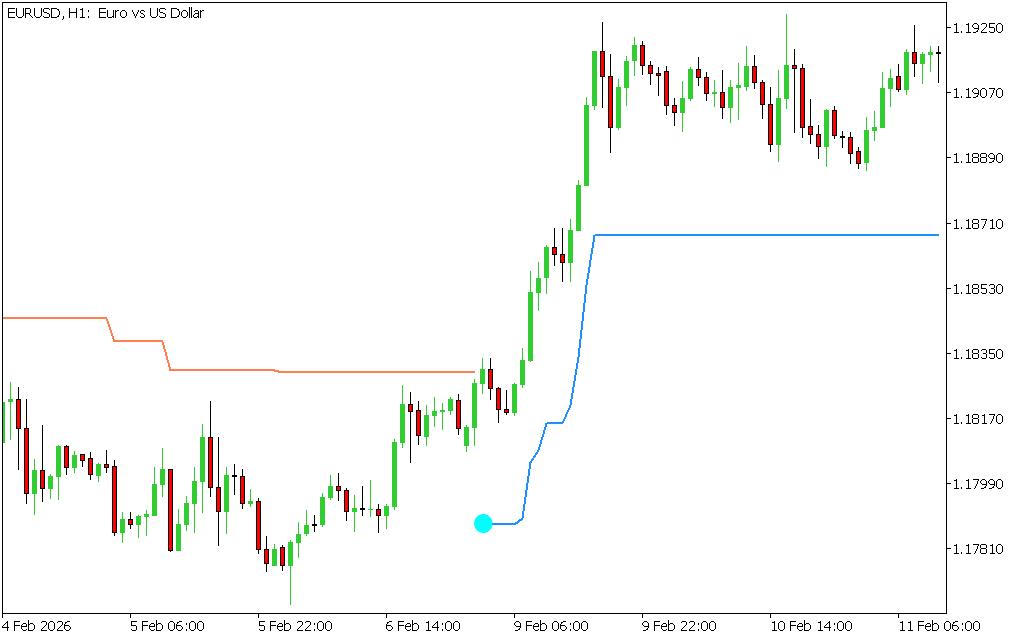
The indicator operates as a seamless visual overlay directly on your main price screen. When looking at the 1-hour (H1) chart, it transitions intelligently between two primary components based on the direction of the dominant market trend:
- The Bearish Resistance Boundary (Orange Line): During a downtrend or consolidation phase, the indicator prints a stepped orange line above the price candles. This line tracks down along with Market Structure, acting as a dynamic ceiling. For swing traders, this orange baseline serves as an optimal structural zone to place defensive stop-losses on short positions.
- The Bullish Support Trailing Line (Blue Line): When institutional volume triggers an aggressive breakout to the upside, the indicator prints a responsive blue line beneath the price action. Marked by a distinct beginning anchor point, the blue line steps upward as price climbs. It never moves backward, making it a powerful trailing stop tool.
- Volatilty Expansion Adaptability: As seen during explosive momentum legs, the blue or orange line will flatten or expand dynamically. When price action makes a sharp upward run, the blue trailing line moves up sharply to lock in profits, flattening out when the market slows down into a distribution or consolidation range.
Streamlining Trade Management and Protecting Capital
The WATR indicator is highly valued by day traders and trend followers because it removes emotion from trade execution. Instead of manually moving your stop-loss based on fear or greed, you simply adjust your exit parameters along the blue or orange line as each new candle closes.
If the market experiences a sudden, high-velocity reversal that violates the trailing WATR line, it serves as a definitive signal that the micro-trend has ended. This prompt exit shields your capital from a major collapse. By bridging the gap between raw Candlestick Patterns and statistical market volatility, this tool ensures your risk parameters adjust dynamically to real-time market environments.
8 Downloads
Last Update:
May 17, 2026 16:16 PM
Published:
Jan 20, 2026 21:11 PM
Category: