The Power of Synergy: Mastering Trends with the Multiple MA Indicator
In the world of technical analysis, the Moving Average (MA) is considered the "Swiss Army Knife" of indicators. It is the foundation of countless strategies, used to smooth price data, identify trend direction, and establish dynamic Support And Resistance levels. However, relying on a single moving average can often provide a narrow view of the market. The Multiple MA indicator for MetaTrader solves this by overlaying multiple averages onto a single chart, allowing traders to visualize the interaction between short-term momentum and long-term trend structure.
What is the Multiple MA Indicator?
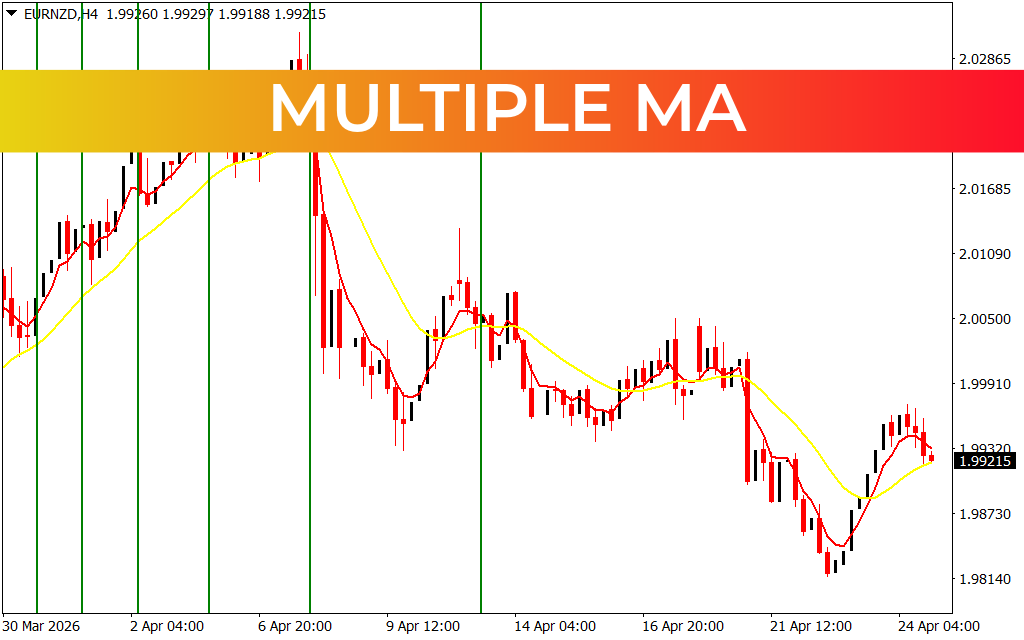
The Multiple MA indicator is a trend-following system that plots two or more moving averages—typically a "fast" and a "slow" average—directly onto the Price Action. As seen in the EURNZD H4 chart, the indicator utilizes a fast-moving red line (short-term) and a smoother yellow line (long-term).
By observing the distance between these lines and their relative positions, traders can gauge the "strength" of a trend. When the lines are far apart and sloping in the same direction, the trend is robust. When they begin to converge or "squeeze," it signals that the market is losing momentum and a reversal or consolidation phase is likely.
Identifying High-Probability Crossovers
The primary signal generated by the Multiple MA indicator is the Golden Cross and the Death Cross:
- Bullish Crossover (Red over Yellow): When the faster red line crosses above the slower yellow line, it indicates that short-term buying pressure is overtaking the long-term average. This is often the starting signal for a sustained rally.
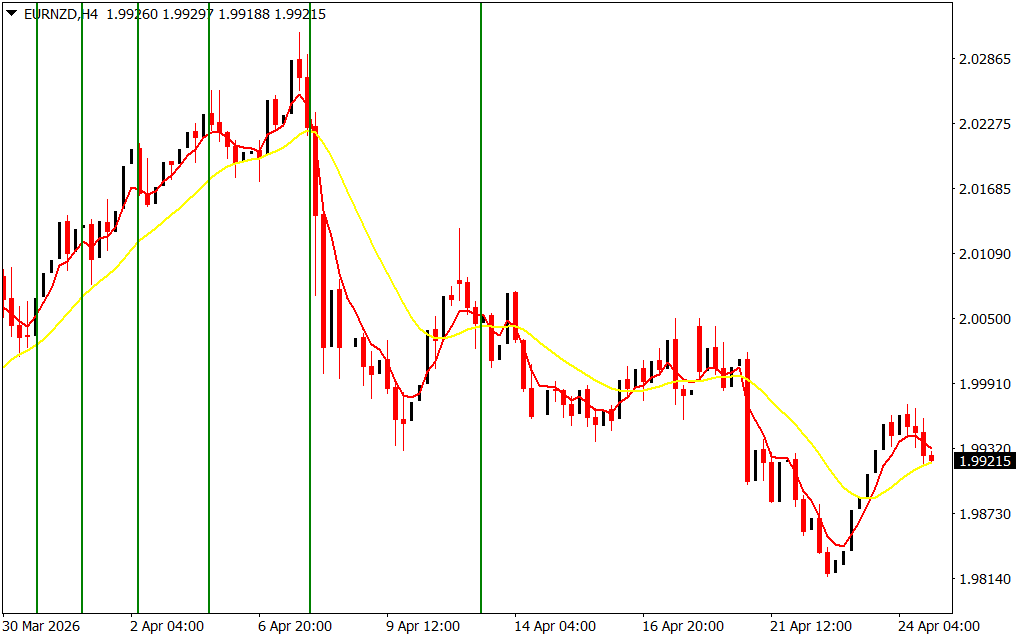
- Bearish Crossover (Red under Yellow): When the red line drops below the yellow line, selling pressure is dominant. In the provided H4 chart, the bearish crossover near the 2.02275 peak accurately forecasted the significant drop toward the 1.98140 level.
- Support and Resistance: In a trending market, price often pulls back to "touch" the yellow line before continuing its primary move. This makes the Multiple MA an excellent tool for identifying high-probability entry points during a trend retracement.
Strategic Application on the H4 Timeframe
The H4 (four-hour) timeframe is often called the "Sweet Spot" for Forex trading. It is high enough to filter out the intraday noise of the M1 or M5 charts, yet fast enough to provide several trading opportunities per week.
The Multiple MA indicator excels on the H4 by providing a clear exit strategy. Many professional traders will hold a position as long as price remains on the correct side of both moving averages. The moment the fast red line crosses back through the yellow line, the "trend cycle" is considered over, providing a mechanical and emotionless exit signal.
Conclusion
The Multiple MA indicator is a clinical tool that brings structural order to the charts. By visualizing the synergy between different time horizons, it allows traders to identify the path of least resistance with higher accuracy. Whether you are a swing trader tracking major trends or a day trader looking for intraday reversals, the Multiple MA provides the essential data needed to trade with professional-grade discipline.
2 Downloads
Last Update:
Apr 25, 2026 16:59 PM
Published:
Feb 02, 2026 17:36 PM
Category: