Master Market Momentum with the Volatility Histogram Indicator for MT4
In the world of financial trading, price movement is only half of the story. The other half—often the most critical for success—is volatility. Understanding how much a pair is moving, and with what intensity, is the difference between catching a massive breakout and getting trapped in a stagnant range. The Volatility Histogram Indicator is a premier tool designed to visualize market energy, allowing traders to see the "hidden" strength behind every candle.
Why Volatility is the Trader’s Best Friend
Most indicators focus purely on direction (trend), but trend-following systems often fail during periods of low volatility (consolidation). The Volatility Histogram solves this by measuring the rate of price change and presenting it in an intuitive, easy-to-read sub-window.
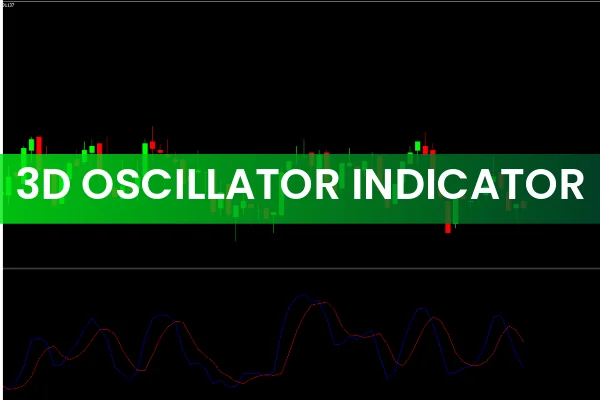
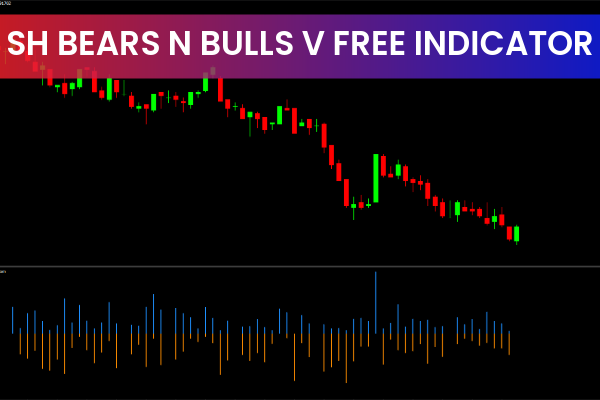
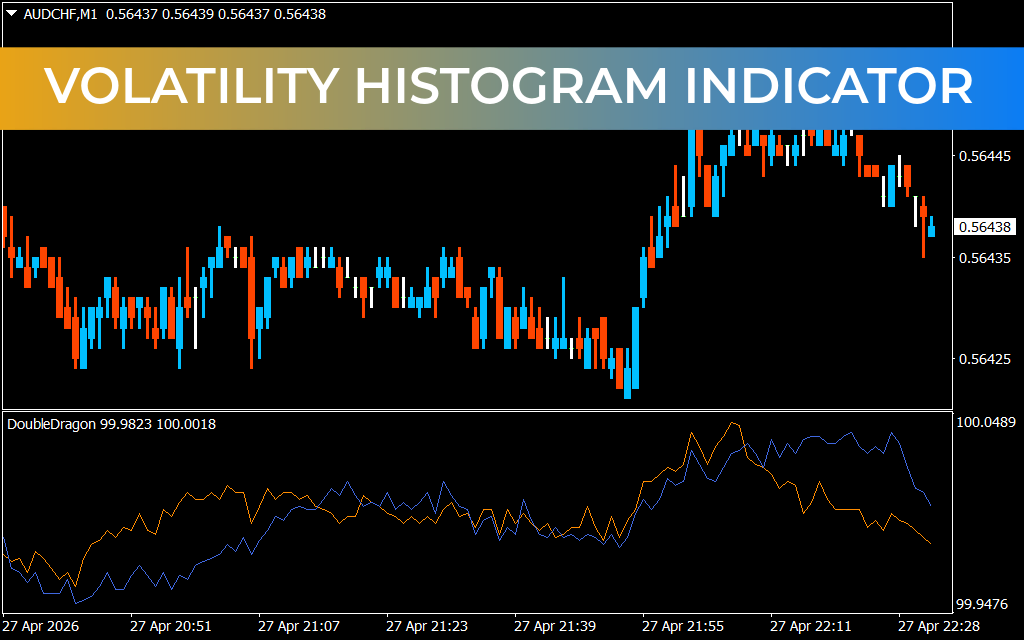
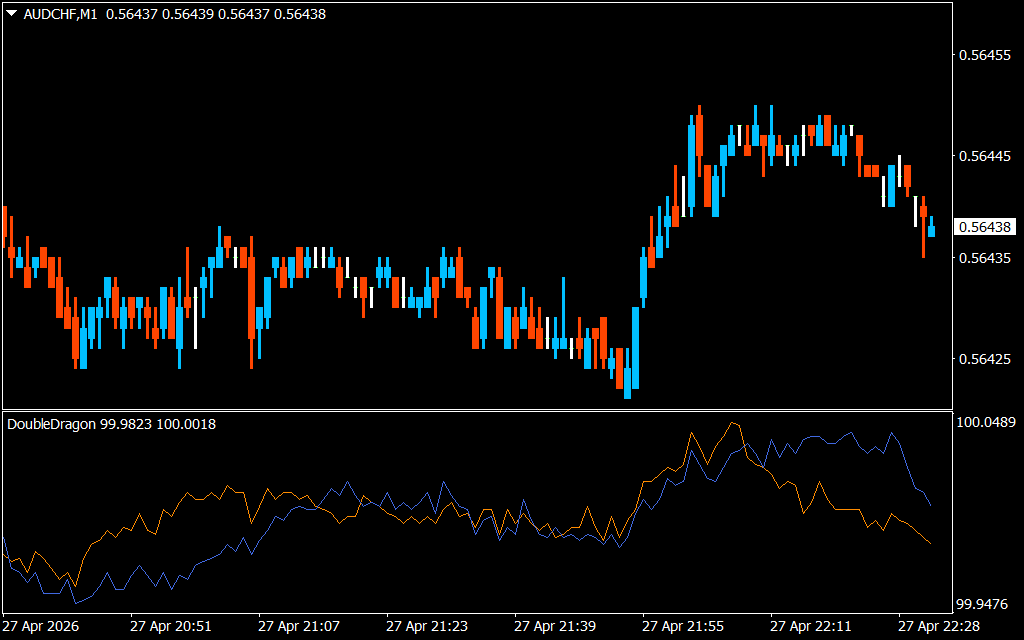
By using a dual-line or histogram-based approach—similar to the "Double Dragon" mechanics seen in high-end trading setups—this indicator separates market noise from high-probability momentum. When volatility spikes, it confirms that institutional money is moving the market, providing the perfect environment for Scalping or swing trading.
Key Features of the Volatility Histogram
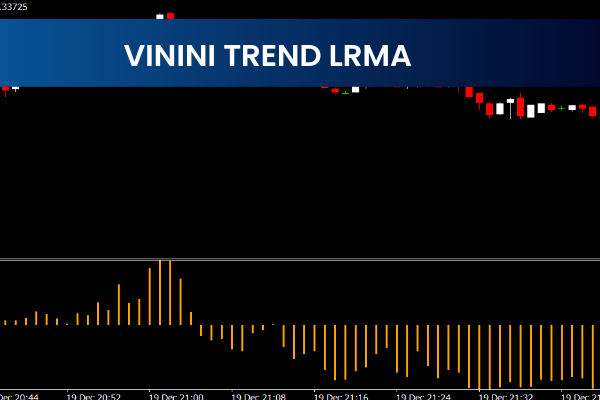
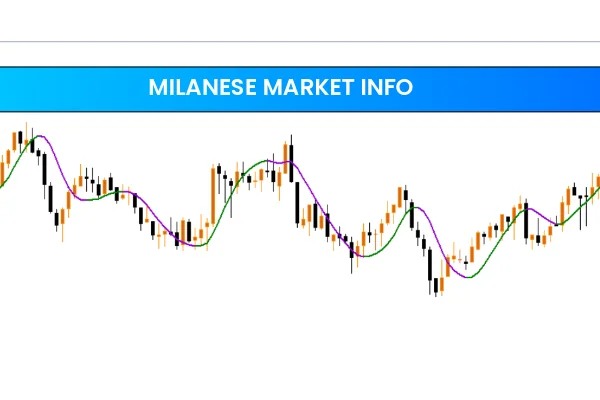
- Momentum Visualization: It identifies when the market is "heating up" or "cooling down" before the Price Action makes it obvious on the main chart.
- Trend Confirmation: Use it to validate breakouts. If price breaks a resistance level but the Volatility Histogram remains flat, it is likely a "fakeout." If the histogram expands, the breakout has the legs to go the distance.
- Optimal Exit Timing: When the histogram bars begin to shrink or lines begin to converge, it signals that the trend is losing steam—giving you the perfect cue to take profits.
- Customizable Parameters: Whether you are trading the M1 for quick scalps or the H4 for long-term trends, the indicator can be adjusted to match the specific volatility signature of any asset.
Strategic Application
The Volatility Histogram is exceptionally powerful when paired with price action. Traders often look for Volatility Squeezes. During these periods, the histogram stays low, indicating a build-up of energy. When the histogram finally "bursts" upward, it signals an explosive move is underway.
Furthermore, by observing the interaction between the fast and slow lines (as shown in the orange and blue "Double Dragon" style oscillators), traders can identify precise entry points where momentum and trend align. This reduces the risk of entering a trade too late and getting caught in a retracement.
1 Download
Last Update:
Apr 28, 2026 01:33 AM
Published:
Jan 31, 2026 22:06 PM
Category: