Master Market Dynamics with the Volatility Histogram Indicator
In the world of professional trading, price movement is only half of the story. The other, often more critical half, is volatility. Volatility represents the intensity and speed of price changes, serving as the "fuel" for market trends. The Volatility Histogram Indicator for MetaTrader is a premier analytical tool designed to quantify this force, providing traders with a clear, visual representation of market energy to improve entry timing and risk management.
The Importance of Measuring Volatility
Trading in a low-volatility environment often leads to "choppy" results, where stop-losses are triggered by minor noise before a trend can develop. Conversely, entering a high-volatility environment without preparation can lead to excessive drawdowns. The Volatility Histogram solves this by normalizing price fluctuations into an intuitive bar chart, allowing you to see at a glance whether the market is in a state of quiet accumulation or explosive expansion.
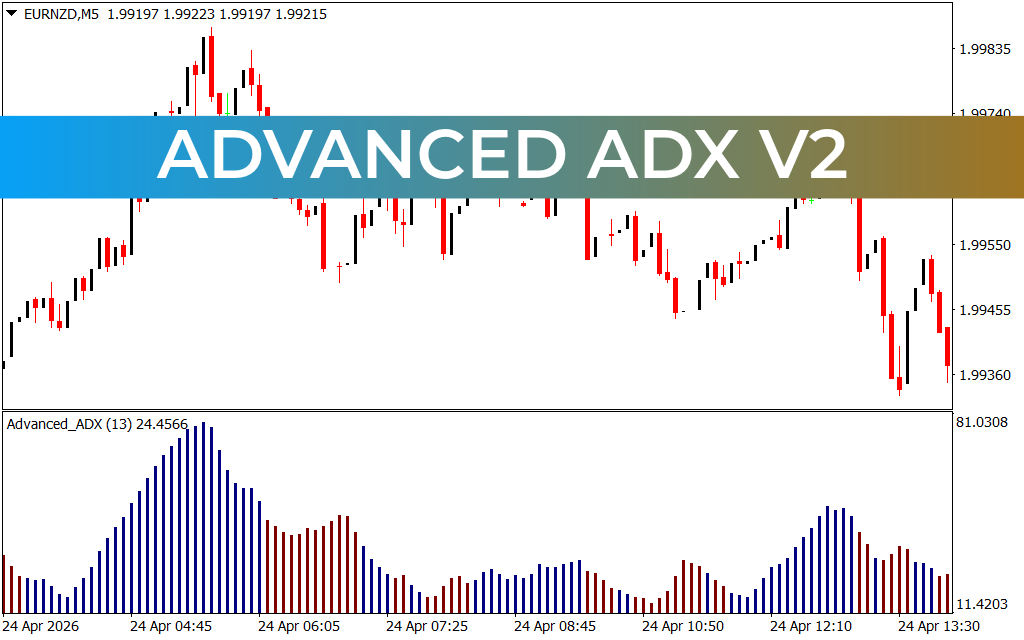
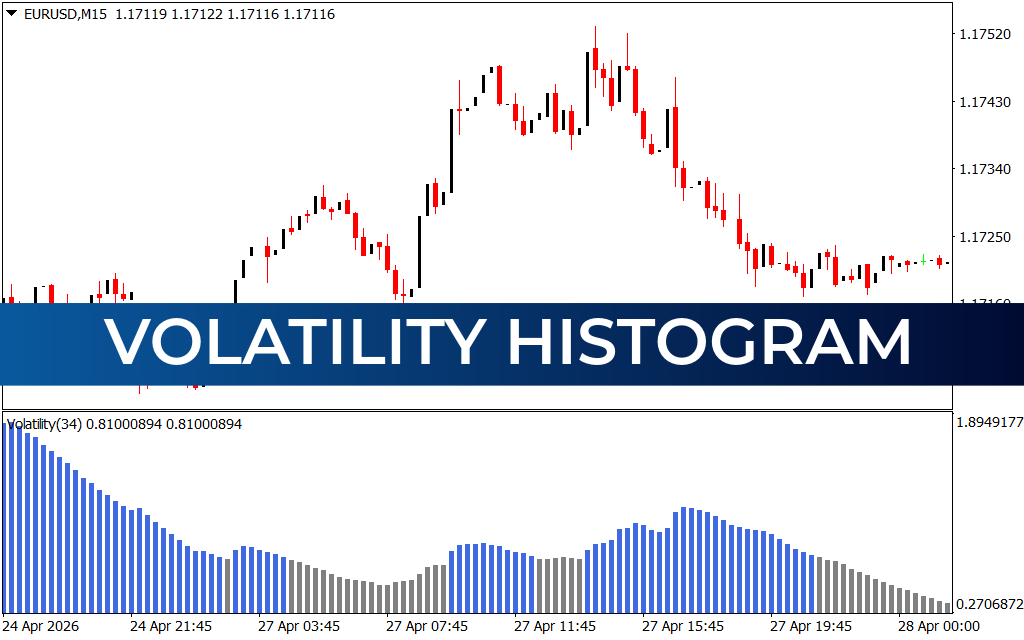
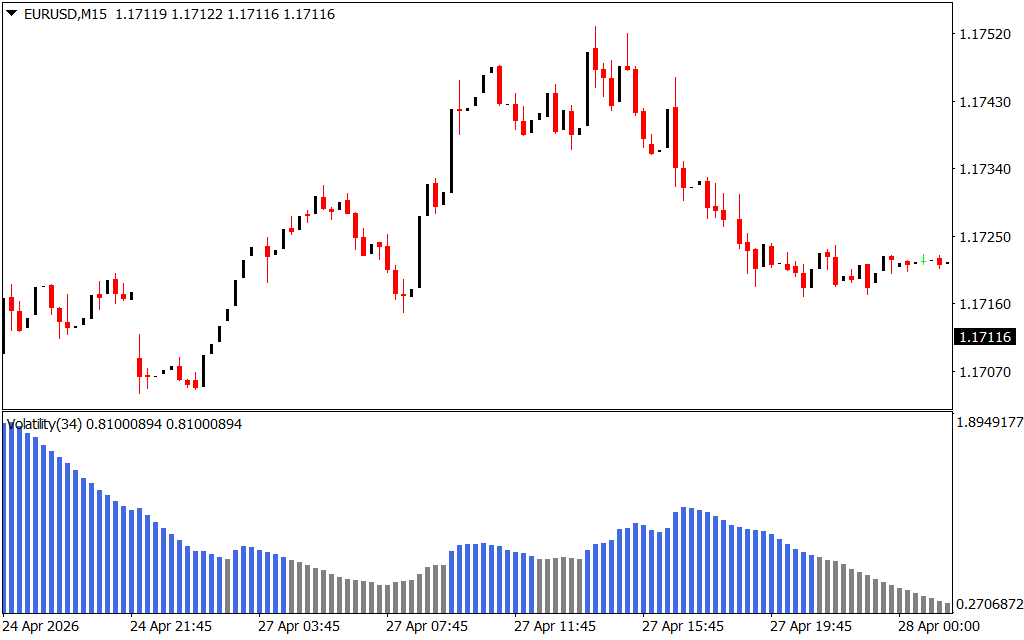
As shown in the EUR/USD M5 and M15 charts, the indicator provides vital strategic insights:
- Trend Confirmation: When price breaks a key level and the Volatility Histogram expands (blue bars), it confirms that the move is backed by real market participation.
- Exhaustion Signals: Exceptionally high histogram peaks often signal a "climax" in Price Action, suggesting that the trend may be overextended and a reversal or consolidation is imminent.
- Volatility Compression: When the histogram bars shrink and turn gray, it indicates a "squeeze" or consolidation phase. Professional traders use these quiet periods to prepare for the inevitable volatility breakout.
Strategic Integration and Trade Filtering
The primary strength of the Volatility Histogram is its role as a high-level filter. For Trend Traders, the goal is to only take signals when volatility is rising. If your primary Trend Indicator gives a "Buy" signal but the Volatility Histogram is flat or declining, it suggests a lack of conviction in the move, helping you avoid potential fakeouts.
For Range Traders and scalpers, the indicator identifies the boundaries of market activity. By observing the average height of the histogram bars, you can set more realistic take-profit targets that align with the current market "pulse." On the M15 timeframe, the indicator reveals long-term cycles of activity, helping you align your intraday trades with the broader institutional flow.
A Professional Dashboard for MetaTrader
The Volatility Histogram is engineered to be a non-lagging, lightweight utility. It provides a "Top-Down" view of market health without cluttering your main price chart. Whether you are navigating the volatile London open or managing positions during the New York session, this indicator provides the structural clarity needed for disciplined execution.
By integrating the Volatility Histogram into your technical arsenal, you move beyond simple price-watching. You gain the ability to read the underlying energy of the market, ensuring you enter when the momentum is highest and stay protected when the market goes quiet. Elevate your technical analysis today with the objective, data-driven precision of the Volatility Histogram.
2 Downloads
Last Update:
Apr 29, 2026 02:20 AM
Published:
Jan 31, 2026 15:00 PM
Category: