Master Precision Entries with the TMS Watch Dog Indicator
In the world of high-probability trading, the Traders Dynamic Index (TDI) is legendary for its ability to combine price sentiment, momentum, and volatility into a single window. However, the true challenge for many traders is knowing exactly when the components of the TDI align for a perfect entry. The TMS Watch Dog Indicator is a sophisticated evolutionary step in this methodology, acting as a vigilant "sentry" for your MetaTrader charts by identifying high-conviction "bounces" and momentum shifts in real-time.
What is the TMS Watch Dog Indicator?
The TMS Watch Dog is an advanced momentum and sentiment oscillator designed for the MetaTrader platform. It is based on the "Trading Made Simple" (TMS) method, which focuses on the interaction between a fast-moving green signal line and a slower red signal line. Unlike a standard RSI or MACD, the TMS Watch Dog is specifically tuned to recognize the mathematical relationship between price velocity and market volatility.
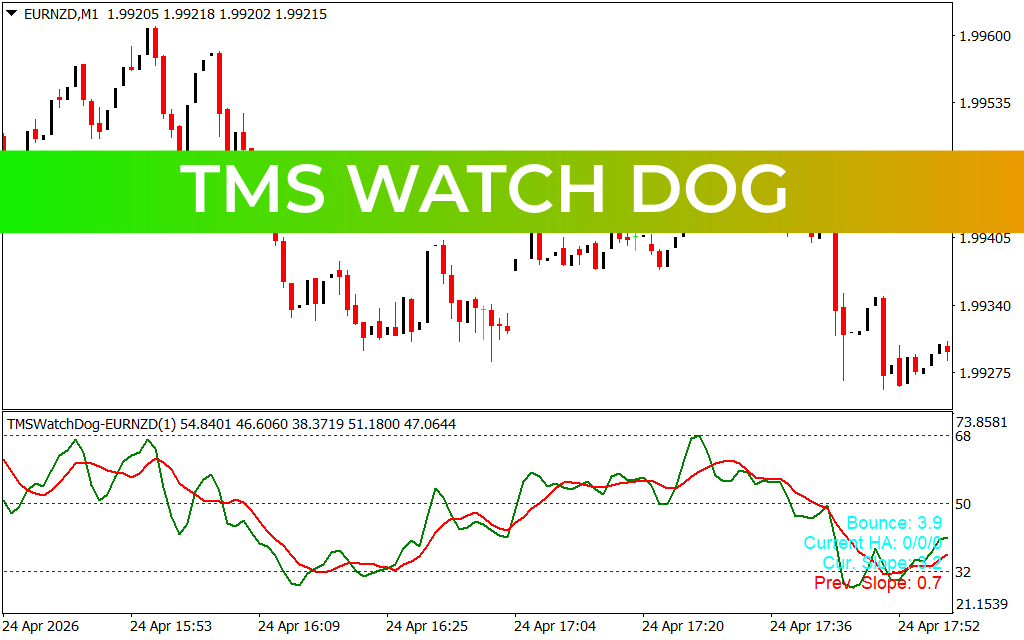
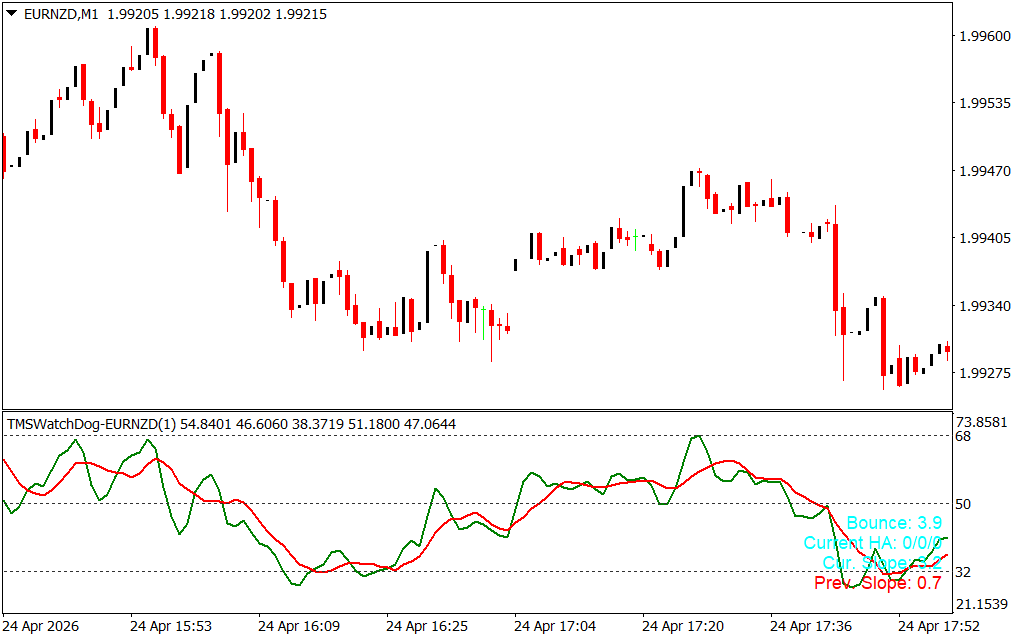
As seen in the EURNZD M1 chart, the indicator features a dynamic interface in a sub-window. It plots the green and red signal lines against fixed levels (such as the 32, 50, and 68 markers). These levels are critical, as they represent the boundaries of market sentiment—ranging from extreme bearishness to aggressive bullishness.
Key Features: The "Bounce" and "Slope" Logic
The "Watch Dog" name comes from the indicator's ability to alert traders to specific high-probability events:
- The RSI Bounce: One of the most powerful setups in the TMS method is the "bounce." When the green line retreats toward the red line but fails to cross it, instead "bouncing" off to continue the trend, it signals a massive influx of momentum. The TMS Watch Dog explicitly tracks this (e.g., "Bounce: 3.9" seen in the dashboard).
- Slope Analysis: The indicator provides real-time data on the "Current Slope" and "Prev Slope." This mathematical value tells you if momentum is accelerating or fading. A positive green slope confirms that the bulls are currently in control.
- Visual Dashboard: The indicator includes an on-chart data panel that summarizes the Current HA (Heiken Ashi) state and slope values. This allows for rapid decision-making without having to manually calculate the angle of the lines.
Strategic Trading Applications
The TMS Watch Dog is built for traders who value confluence:
- Trend Following: When both the green and red lines are above the 50 level and the green line is sloped upward, you have a confirmed bullish environment. Traders look for "green-over-red" crosses to initiate long positions.
- Mean Reversion: When the lines reach the 68 level (Overbought) or the 32 level (Oversold) and begin to curve back toward the 50 line, it signals that the market is overextended and a correction is likely.
- Scalping Precision: On lower timeframes like the M1, the TMS Watch Dog acts as a noise filter. It prevents you from entering late into a move by showing exactly when the "slope" begins to flatten.
Conclusion
The TMS Watch Dog Indicator is an essential tool for any trader utilizing the Traders Dynamic Index or the Trading Made Simple philosophy. It removes the subjectivity of "eyeballing" crossovers and replaces it with hard mathematical data. By integrating this indicator into your MetaTrader setup, you gain a vigilant partner that ensures you only trade when the momentum is truly in your favor.
2 Downloads
Last Update:
Apr 26, 2026 01:41 AM
Published:
Feb 02, 2026 02:54 AM
Category: