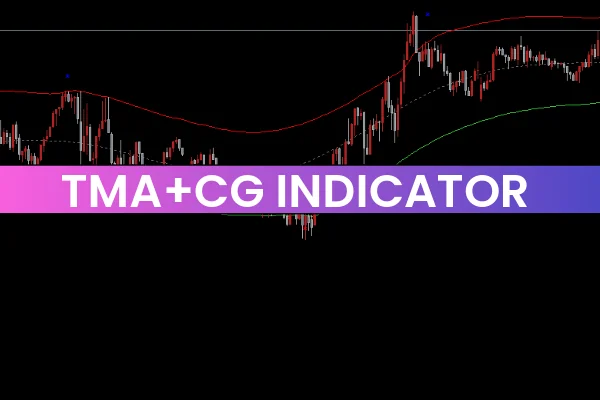
The TMA+CG Indicator for MT4 is designed for traders who rely on channel trading and price-action confirmation. It combines the Triangular Moving Average (TMA) with the Center of Gravity (CG) concept to create smooth, accurate trading channels. These channels help traders identify dynamic Support And Resistance levels, making it easier to forecast potential reversals or Trend Continuation setups.

This indicator eliminates the need to manually draw channels, saving time while offering consistent accuracy. Because it is simple to use, both beginners and experienced traders can benefit from the TMA+CG indicator. Traders can use it for swing trading, day trading, and even Scalping across all forex pairs and other financial instruments.
How the TMA+CG Indicator Works
The TMA+CG indicator plots two main channel lines:
Upper Channel Line: Acts as dynamic resistance or an overbought zone.
Lower Channel Line: Acts as dynamic support or an oversold zone.
Between these bands, traders can clearly observe price movement behavior. When price interacts with either the upper or lower band, it helps signal potential trend changes—similar to how Bollinger Bands function, but with smoother calculations due to the TMA component.
Smoothed Moving Averages for Cleaner Signals
The TMA+CG indicator uses smoothed moving averages, providing clearer signals than standard TMA indicators. Since it responds less aggressively to short-term volatility, traders can avoid many false or noisy signals in live market conditions.
This filtered movement helps traders spot true market direction and understand when the price is stretching too far from its equilibrium.
Buy and Sell Signals With the TMA+CG Indicator
Using the TMA+CG Indicator for MT4, traders can identify reliable entry points by watching how price reacts at the channel boundaries.
Buy Signal Rules
Buy when price touches the lower band, which serves as dynamic support.
A blue cross appears when price moves outside the channel upward—confirming a potential bullish reversal.
Place stop-loss below the recent swing low or near the blue cross.
Sell Signal Rules
Sell when price touches the upper band, the dynamic resistance.
A red cross forms when price moves beyond the channel downward—indicating a potential bearish move.
Place stop-loss above the recent swing high or near the red cross.
These crosses act as high-precision signals, making the TMA+CG Indicator ideal for traders who prefer systematic and mechanical entries.
Chart Example Explanation
In the chart example of GBP/USD:
The indicator draws two channel lines:
Green line: Lower band (support).
Red line: Upper band (resistance).
When price breaks below the channel, the indicator prints red crosses, signaling a potential buying opportunity.
The trend moved over 60 pips upward after a clear buy signal.
When price approaches or touches the upper band, a red arrow or cross appears, signaling a sell setup.
After one such signal, the market fell more than 100 pips, highlighting the effectiveness of this tool.
This behavior makes the TMA+CG indicator suitable for high-probability reversal trading in trending and ranging markets.
Using TMA+CG With Other Indicators
While the TMA+CG indicator performs well on its own, combining it with other indicators such as:
RSI
MACD
Moving Averages
Volume indicators
…can improve accuracy by confirming momentum and preventing premature entries.
Conclusion
The TMA+CG Indicator for MT4 is a powerful tool for channel traders who want consistent and clear buy and sell signals. With its dynamic support and resistance zones, red and blue cross markers, and smoothed moving averages, it enables traders to identify trend changes early. To enhance your trading strategy further and download this indicator for free, visit IndicatorForest.com for more premium MT4 tools.
FAQ
4 Downloads
Published:
Nov 24, 2025 02:56 AM
Category: