Master Market Geometry with the Parallel Pivot Lines Indicator for MT4
In the realm of professional technical analysis, Price Action is rarely random; it often moves within specific geometric corridors defined by supply, demand, and institutional equilibrium. While standard horizontal pivot points provide excellent "floors and ceilings," they often fail to account for the slanted nature of trending markets. The Parallel Pivot Lines Indicator for MetaTrader 4 (MT4) is a definitive solution designed to bridge this gap. By projecting multi-layered parallel channels based on structural pivot highs and lows, it provides a comprehensive map of market geometry.
The Power of Slanted Equilibrium
Standard pivots are calculated using the previous period's high, low, and close to create static levels. Parallel Pivot Lines evolve this concept by integrating linear regression and structural trend analysis. Instead of flat lines, this indicator identifies the "angle of attack" of a trend and projects parallel levels of Support And Resistance that move in sync with price. This allows traders to visualize the "fair value" corridor of an asset as it climbs or descends.
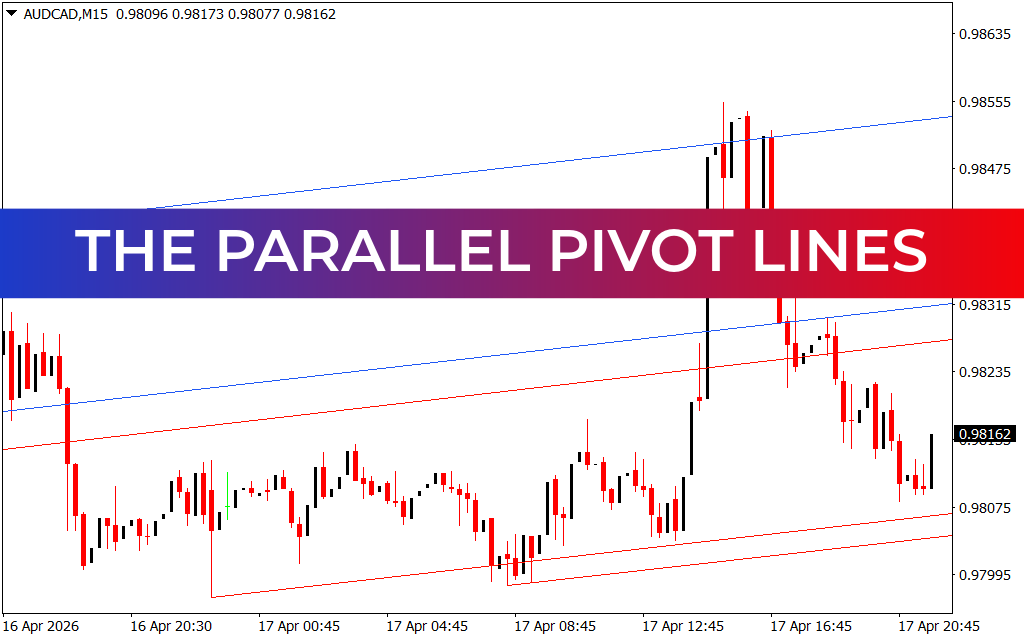
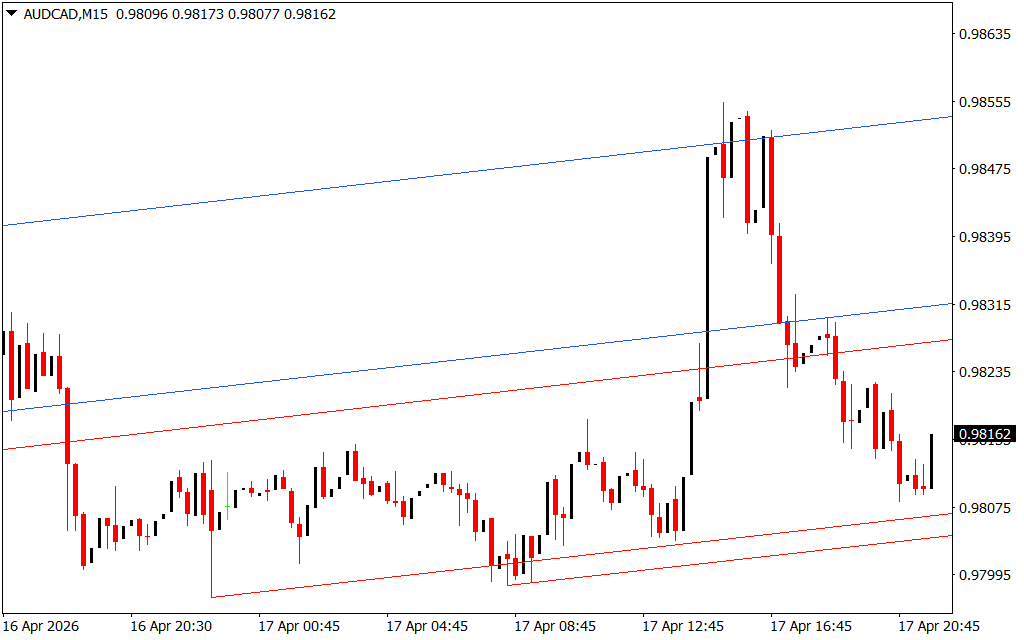
As demonstrated in technical analysis on complex price structures like AUD/CAD on the M15 timeframe, the Parallel Pivot system provides several definitive operational advantages:
- Multi-Zone Structural Mapping: The indicator typically plots a median line flanked by upper and lower parallel bands. As seen on recent M15 charts, these bands act as dynamic zones of interest. When price remains within the inner blue channels, the trend is considered stable; a move into the outer red zones suggests a state of overextension.
- Precision Breakout Identification: One of the most powerful uses of parallel geometry is identifying when a market "regime" has changed. If price aggressively breaks through the outermost parallel line and holds, it signals a structural shift from one trend angle to another, offering a high-probability entry for long-term swing trades.
- Dynamic Support and Resistance: Unlike static levels that price may never reach, parallel lines evolve with every new candle. This ensures that you always have a relevant target and stop-loss reference, regardless of how steeply the market is trending.
- Visualizing Volatility Cycles: During high-volatility sessions, the distance between the parallel lines expands, providing a visual representation of market stress. When the lines begin to converge or "flatten," it signals an impending consolidation or reversal.
Strategic Implementation for Systematic Traders
The Parallel Pivot Lines Indicator is an essential asset for any trader who values a disciplined, geometric approach to the financial markets.
- The Channel Fade: Look for price to touch the outermost parallel red line during a trend. If price action shows a rejection candle (like a pin bar), it provides a low-risk opportunity to trade back toward the median blue line.
- Trend-Following Core: In a strong bullish trend, use the lower parallel lines as "buy the dip" zones. This allows you to enter at the most mathematically favorable price within a trending corridor.
- Cross-Timeframe Synergy: Align the parallel channels on the M15 with the H1. When price is at the bottom of the channel on both timeframes simultaneously, the probability of a successful bounce increases exponentially.
Conclusion
The Parallel Pivot Lines Indicator for MT4 is a definitive tool for traders who demand institutional-grade oversight. By bridging the gap between horizontal pivots and trendline geometry, it empowers you to navigate the markets with grounded, professional confidence. Elevate your technical analysis today and master market geometry with the Parallel Pivot system.
9 Downloads
Last Update:
Apr 18, 2026 22:25 PM
Published:
Feb 04, 2026 14:29 PM
Category: