Master Market Geometry with the Swing Point Indicator
Identifying the structural highs and lows of the market is the foundational skill of every successful Price Action trader. Without a clear understanding of where a trend begins or ends, technical analysis becomes mere guesswork. The Swing Point indicator for MetaTrader 4 is a professional-grade tool designed to strip away market noise and highlight the critical "turning points" where institutional orders are often concentrated.
What is the Swing Point Indicator?
The Swing Point indicator is a technical tool that automatically identifies and connects significant peaks and troughs on your chart. By analyzing price candles over a specific lookback period, it filters out minor fluctuations and focuses on the structural "swing" of the market.
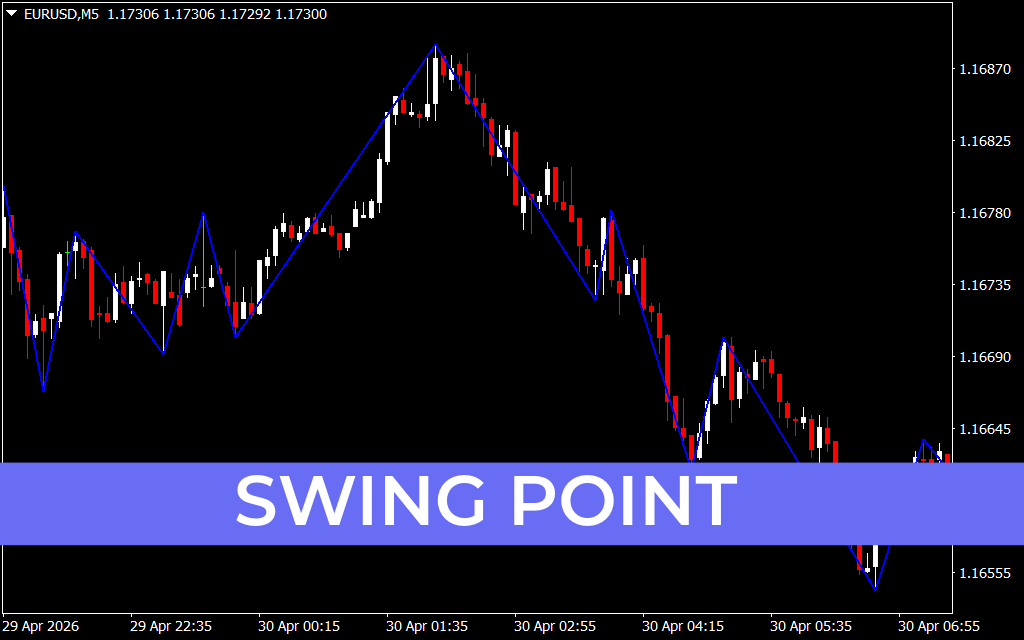
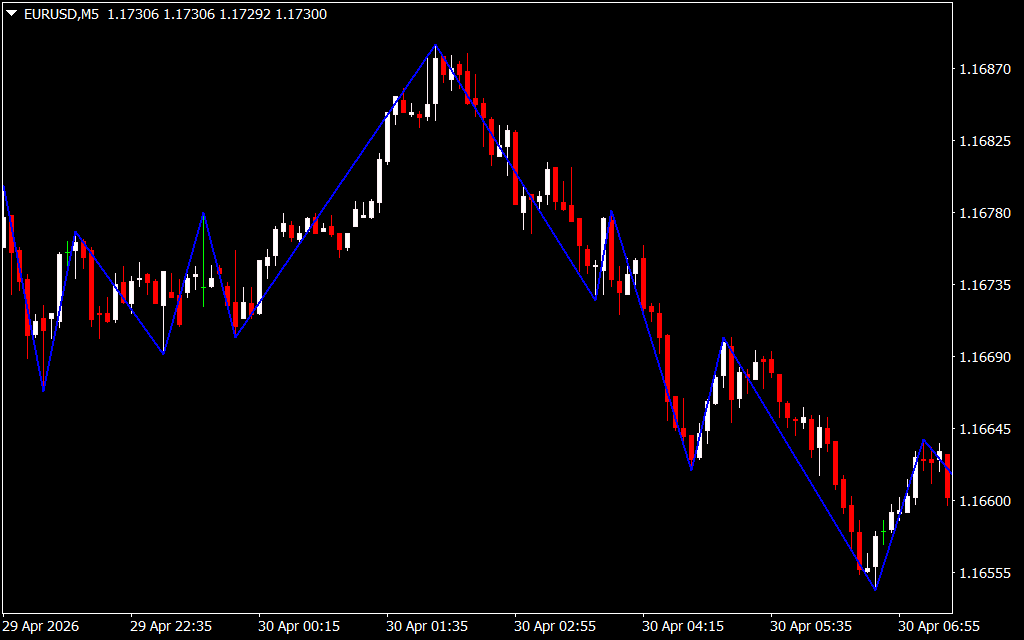
As demonstrated in the provided chart, the indicator plots a continuous blue zigzag line that anchors itself to the absolute highs and lows of price movements. This visual framework makes it incredibly easy to identify the current market phase—whether it is an uptrend making higher highs, or a downtrend carving out lower lows.
Key Benefits for Technical Traders
- Objective Structure Identification: One of the hardest tasks for beginners is identifying "valid" swings. The Swing Point indicator removes subjectivity, providing a consistent mathematical approach to Market Structure.
- Precise Trend Analysis: By connecting swing highs and lows, the indicator reveals the trend at a glance. When the blue line consistently moves upward, the bullish momentum is confirmed; when it moves downward, bearish dominance is clear.
- Hidden Support And Resistance: Swing points represent areas where price has historically reversed. These peaks and troughs serve as "memory levels" for the market, acting as highly reliable horizontal support and resistance zones for future trades.
- Enhanced Harmonic and Wave Trading: If you utilize Elliot Wave theory or Harmonic patterns, the Swing Point indicator acts as an essential "skeleton," helping you label waves and patterns with much higher accuracy.
Strategic Trading with Swing Points
To maximize the potential of the Swing Point indicator, traders should focus on the Break of Structure (BOS) and Trend Continuations.
- Trend Confirmation: In a healthy uptrend, look for price to break above the previous "high" swing point. This breakout suggests that the momentum is still intact and offers a high-probability entry for long positions.
- Stop-Loss Placement: Professional traders often place their stop-losses just beyond the most recent swing point. Because these areas are structural foundations, if price breaches them, the original trade thesis is likely invalidated.
- Fibonacci Confluence: Draw Fibonacci retracement levels from one major swing point to the next. When a pullback aligns with a previous structural swing point, it creates a "confluence zone" that institutions use for heavy buying or selling.
Conclusion
The Swing Point indicator is more than just a visual aid; it is a roadmap of market psychology. By highlighting the areas where price has decisively changed direction, it allows you to trade in harmony with the actual structure of the market rather than fighting against it. Whether you are a scalper looking for quick turns or a swing trader following long-term cycles, the Swing Point indicator provides the structural clarity needed to navigate the Forex market with confidence.
9 Downloads
Last Update:
Apr 30, 2026 23:27 PM
Published:
Jan 30, 2026 18:30 PM
Category: