Precision Market Timing with the Stochastic Oscillator for MT4
In the fast-paced world of Forex and CFD trading, identifying the exact moment a trend is losing steam is the key to consistent profitability. While trend-following tools tell you where the market is going, momentum oscillators tell you when it is likely to stop. The Stochastic Oscillator for MetaTrader 4 (MT4) is one of the most enduring and reliable technical tools available, specifically engineered to pinpoint overextended price levels and imminent trend reversals.
What is the Stochastic Oscillator?
Developed by George Lane in the late 1950s, the Stochastic Oscillator measures the relationship between an asset's closing price and its price range over a specific period. The logic is simple yet profound: during an uptrend, prices tend to close near their highs; during a downtrend, they close near their lows.
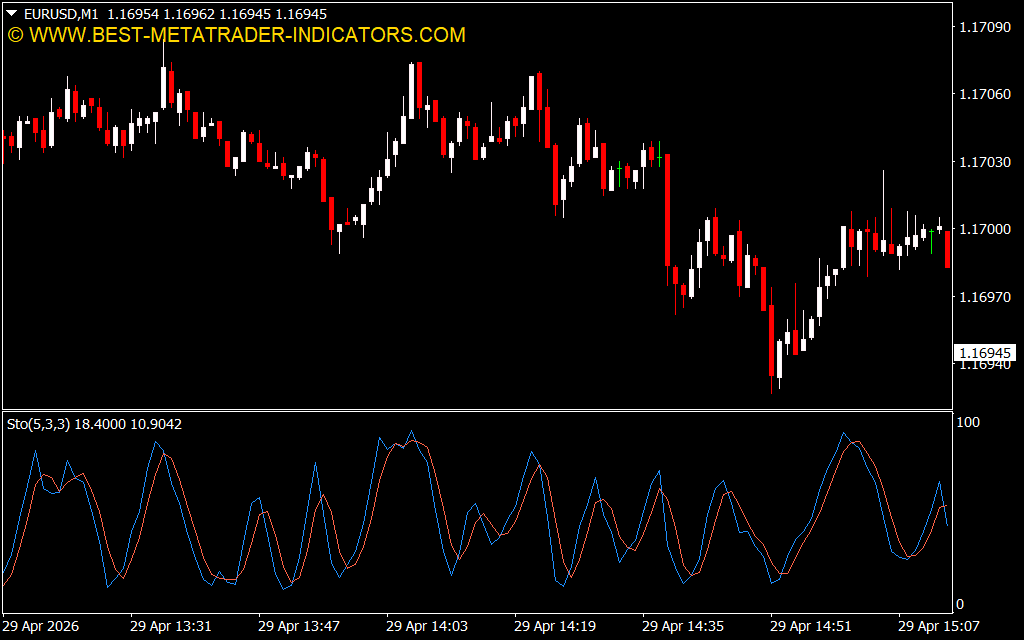
As illustrated on the EUR/USD M1 chart, the indicator appears in a separate sub-window and consists of two primary lines:
- %K (The Fast Line): The main line representing the current mathematical value of the oscillator.
- %D (The Slow Line): A moving average of %K that acts as a signal line for smoother analysis.
Identifying Overbought and Oversold Extremes
The Stochastic is a bounded oscillator, moving strictly between values of 0 and 100. This fixed scale makes it incredibly easy to read at a glance:
- Overbought (Above 80): When the lines rise above the 80 level, the market is considered overextended to the upside. This doesn't necessarily mean an immediate crash, but it signals that the buying pressure is becoming exhausted.
- Oversold (Below 20): When the lines drop below 20, the market is statistically overextended to the downside, suggesting that a relief rally or a full reversal may be on the horizon.
Strategic Trading Applications
The Stochastic Oscillator is a versatile powerhouse that can be used in multiple ways to enhance your MT4 trading strategy:
- Signal Line Crossovers: A classic "Buy" signal is generated when the %K line crosses above the %D line while both are in the oversold region. Conversely, a "Sell" signal occurs when the %K crosses below %D in the overbought region.
- Divergence Hunting: This is perhaps the indicator's strongest feature. If the price makes a new high but the Stochastic fails to surpass its previous peak, "Bearish Divergence" is present. This warns traders that the price movement lacks the momentum to sustain its current direction.
- Trend Filtering: In a strong trending market, the Stochastic can remain in overbought or oversold territory for a long time. Professional traders use it to "buy the dip" by waiting for the oscillator to drop into the oversold zone during a macro uptrend.
Conclusion
The Stochastic Oscillator remains a staple on professional trading desks because it provides a mathematical framework for human emotion—fear and greed. By identifying when these emotions have pushed prices to a breaking point, it allows you to enter and exit trades with surgical timing. Whether you are a scalper on the M1 timeframe or a swing trader on the Daily charts, the Stochastic is a mandatory addition to your MT4 toolkit for data-driven decision-making.
2 Downloads
Last Update:
Apr 29, 2026 20:15 PM
Published:
Jan 30, 2026 19:49 PM
Category: