Master Trend Discipline with the Step EMA Line Indicator
In the fast-moving world of Forex trading, the biggest challenge for any trader is distinguishing between a genuine Trend Reversal and temporary market "noise." Traditional Exponential Moving Averages (EMAs) are excellent for smoothing price data, but they often lag behind rapid price shifts or produce "sawtooth" signals in consolidating markets. The Step EMA Line indicator is a sophisticated evolution of the classic EMA, designed to provide a more disciplined, structural view of the market directly on your MetaTrader charts.
The Logic of the "Step" Mechanism
Unlike a standard moving average that follows price in a continuous, curved path, the Step EMA Line remains horizontal until a specific price threshold or volatility shift is met. This "stepped" behavior creates a clear, algorithmic boundary for the current trend. When the market is moving sideways, the line stays flat, preventing traders from being lured into low-probability trades. When the price breaks a certain level, the line "steps" up or down to follow the new momentum.
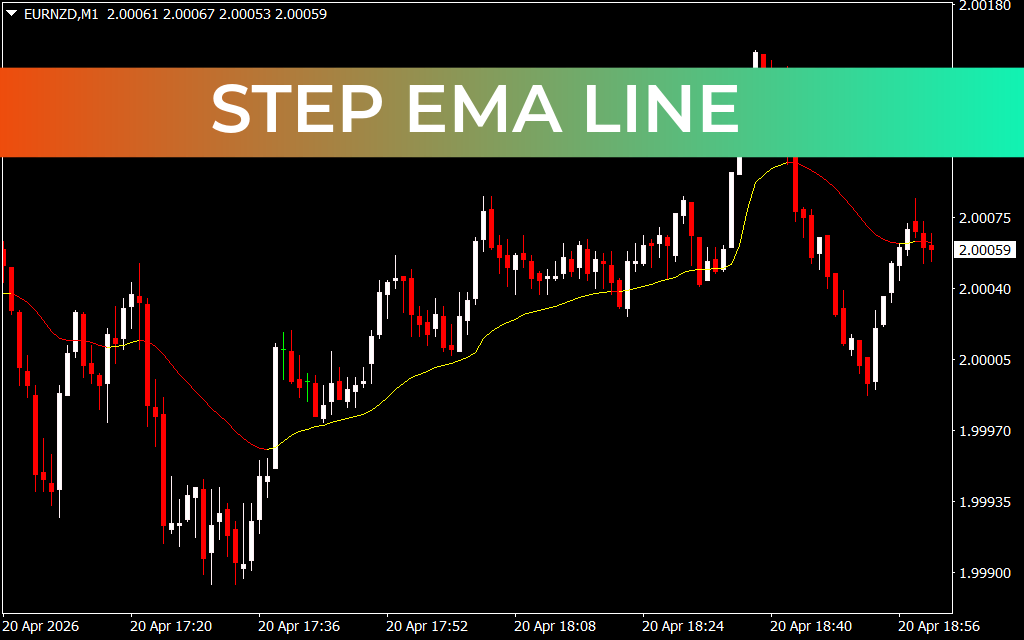
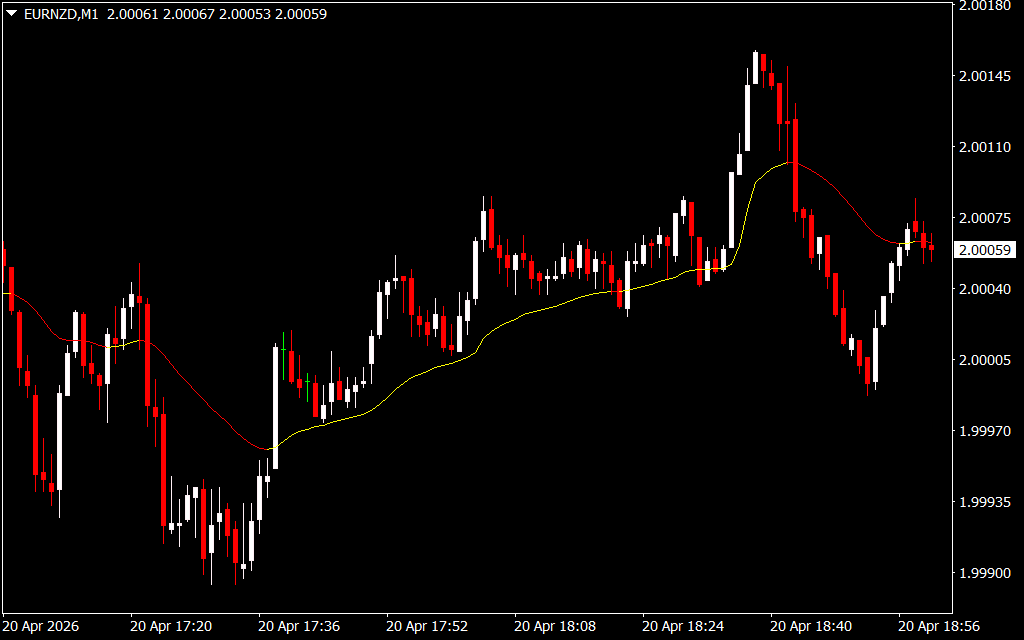
As demonstrated on the EURNZD M1 chart, the indicator provides immediate visual clarity:
- The Yellow Support Phase: When the price is trading above the line and the indicator turns yellow, the market is in a confirmed bullish state. This line acts as a dynamic support level that only moves up as new highs are established.
- The Red Resistance Phase: When the price breaks below the line and it shifts to red, the bearish trend is confirmed. The indicator then serves as a trailing resistance level, helping traders stay committed to short positions.
- Volatility Filtering: Because the line only "steps" when significant price movement occurs, it naturally filters out minor retracements that would otherwise trigger a premature exit in a standard EMA system.
Strategic Advantages for Intraday Traders
For scalpers and day traders operating on the 1-minute (M1) or 5-minute (M5) timeframes, the Step EMA Line offers a unique advantage: structural discipline.
- Objective Stop Losses: The "steps" provide natural, mathematically sound levels for placing stop-loss orders. Instead of picking an arbitrary pip amount, traders can place their stops just behind the current step level.
- Trend Reinforcement: Use the Step EMA as your primary trend filter. If the line is red, focus exclusively on sell signals from your other oscillators. If it is yellow, look only for buying opportunities.
- Breakout Confirmation: A sudden "step" after a long flat period is often the first signal of a high-momentum breakout. This allows traders to enter a move at the very beginning of a new trend cycle.
Why Every MetaTrader Setup Needs It
The Step EMA Line transforms your chart from a chaotic series of candles into a structured map of trend and resistance. It removes the emotional urge to overtrade during flat markets and provides the confidence needed to ride long trends to their completion.
In a pair as dynamic and volatile as EURNZD, having a tool that understands Market Structure is essential. The Step EMA Line is a professional-grade indicator that provides the clarity, precision, and discipline required to navigate modern Forex markets successfully.
4 Downloads
Last Update:
Apr 20, 2026 22:02 PM
Published:
Feb 03, 2026 16:21 PM
Category: