Measure Market Volatility with the Standard Deviation Indicator
In the financial markets, price movement is rarely a straight line. It is a constant tug-of-war between buyers and sellers, characterized by periods of extreme activity followed by quiet consolidation. To navigate these shifts, professional traders rely on volatility metrics to gauge risk and opportunity. The Standard Deviation Indicator is the gold standard for measuring these fluctuations, providing a mathematical foundation for understanding market behavior.
What is the Standard Deviation Indicator?
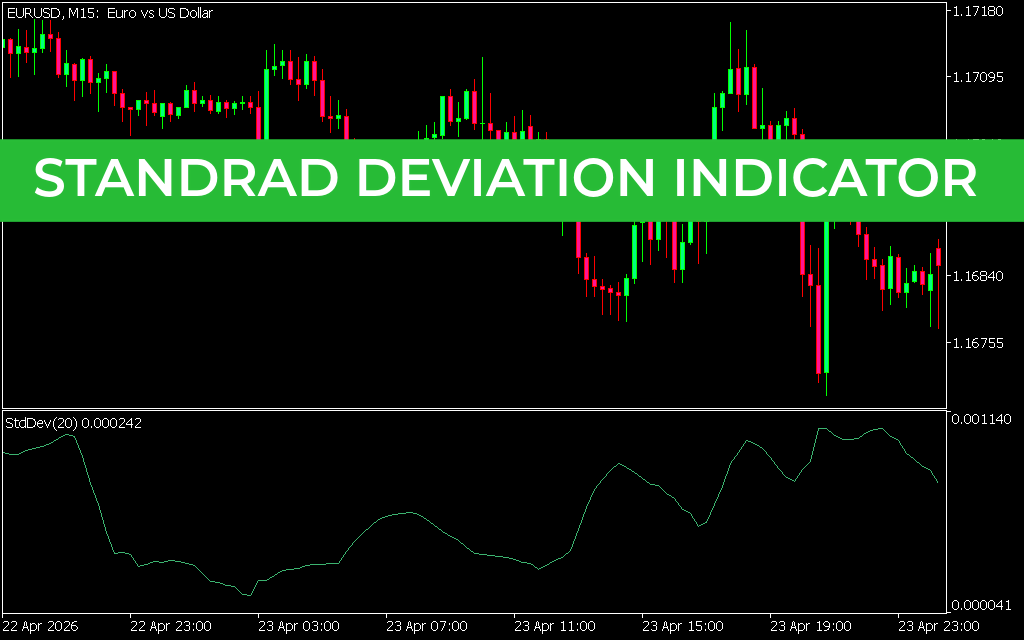
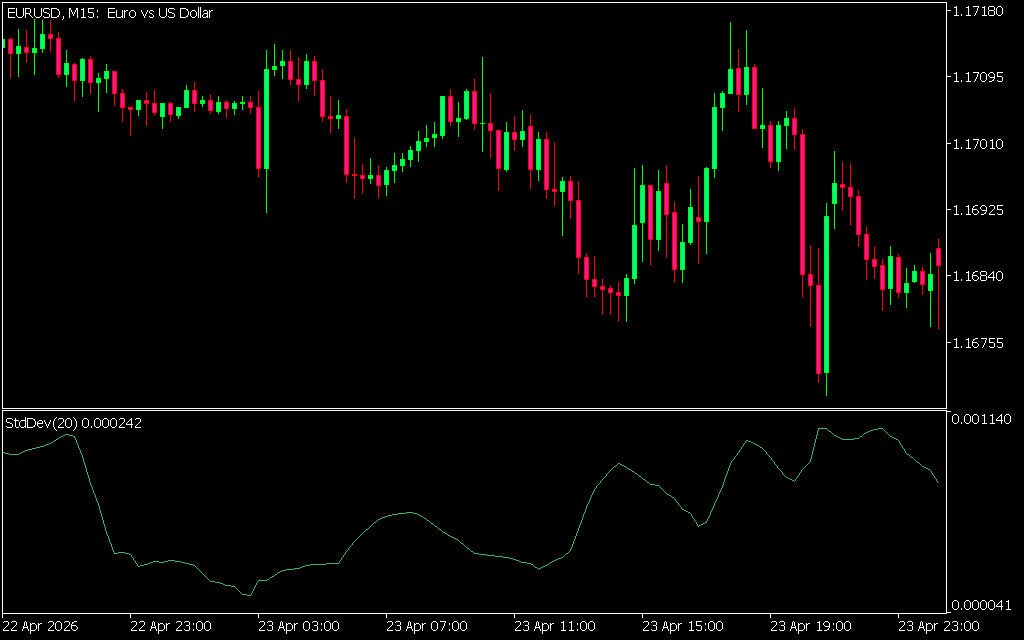
The Standard Deviation Indicator is a statistical tool that measures the extent of price dispersion relative to a moving average. In trading terms, it quantifies volatility. When the indicator value is high, it means price swings are large and the market is highly volatile. When the value is low, the price is stable and sticking close to its average.
As seen in the EURUSD M15 chart, the indicator appears as a single oscillating line in a sub-window. Unlike trend indicators that tell you "where" the price is going, Standard Deviation tells you "how fast" and "how far" the price is deviating from its norm.
Why Volatility Analysis is Critical
Most trading strategies fail not because the direction was wrong, but because the trader didn't account for volatility. High volatility offers the potential for large profits but comes with increased risk and wider stop-loss requirements. Low volatility, while safer, can lead to "choppy" markets where trades go nowhere.
The Standard Deviation Indicator helps you identify these regimes:
- The Calm Before the Storm: Very low indicator readings suggest a market that is "coiling." These periods of low volatility are often followed by massive breakouts.
- The Overextended Market: Extremely high readings suggest that the current move may be overstretched. Markets rarely sustain extreme volatility for long, often returning to the mean shortly after a spike.
How to Trade with Standard Deviation
The most effective way to use this tool is as a filter for other technical signals. Many traders pair it with Bollinger Bands®—which actually use standard deviation in their calculation—to identify "squeezes" and "bulges."
- Breakout Confirmation: If you see a price breakout accompanied by a rising Standard Deviation line, it confirms that the move has the necessary momentum to continue.
- Mean Reversion: When the indicator reaches a historical peak and starts to curve downward, it signals that volatility is subsiding. This is often a prime time for mean-reversion traders to look for prices to return to the moving average.
- Risk Management: You can use the current standard deviation value to set dynamic stop-losses. In high-volatility environments, your stops should be wider to avoid being "wicked out" by noise.
By integrating the Standard Deviation Indicator into your MetaTrader toolkit, you gain a professional-grade lens through which to view market risk. It is an essential component for any trader who wants to master the art of timing and position sizing.
1 Download
Last Update:
Apr 25, 2026 22:32 PM
Published:
Feb 02, 2026 14:08 PM
Category: