Master Market Volatility with the Standard Deviation Indicator for MT4
In financial trading, the ability to quantify risk is just as important as predicting price direction. While most traders focus on trend-following or momentum, professional analysts look at the "volatility profile" of an asset. The Standard Deviation indicator for MetaTrader 4 (MT4) is a fundamental statistical tool that measures how much price deviates from its average, providing a clear mathematical view of market activity and impending volatility shifts.
What is the Standard Deviation Indicator?
Standard Deviation is a statistical term that measures the dispersion of a dataset relative to its mean. In the context of MT4, this indicator calculates the difference between each bar's closing price and a simple moving average. When price fluctuations are high and away from the average, the Standard Deviation value increases. When the market is calm and price stays close to the average, the value decreases.
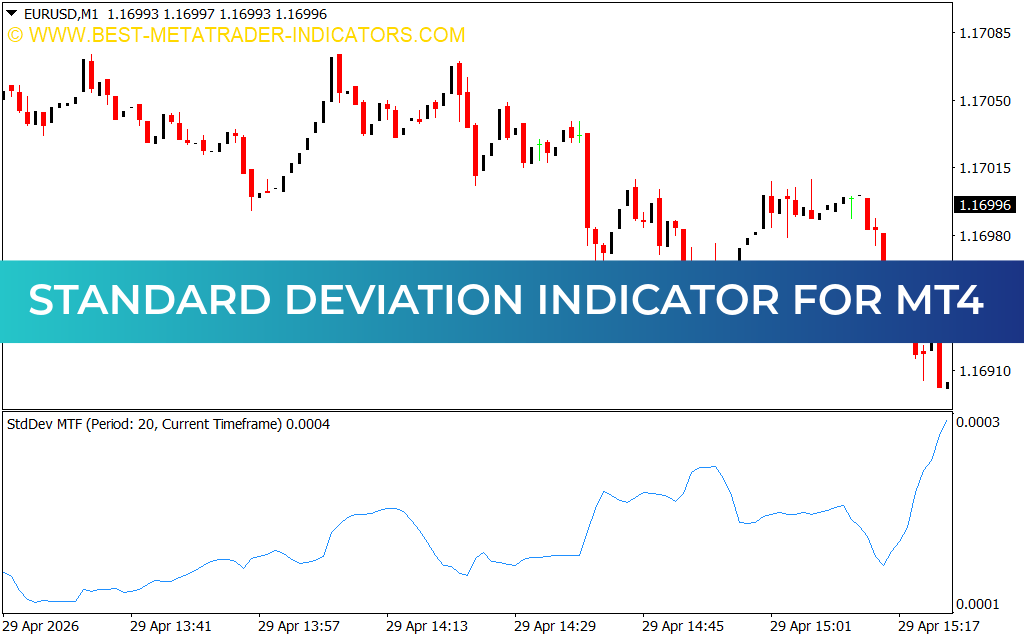
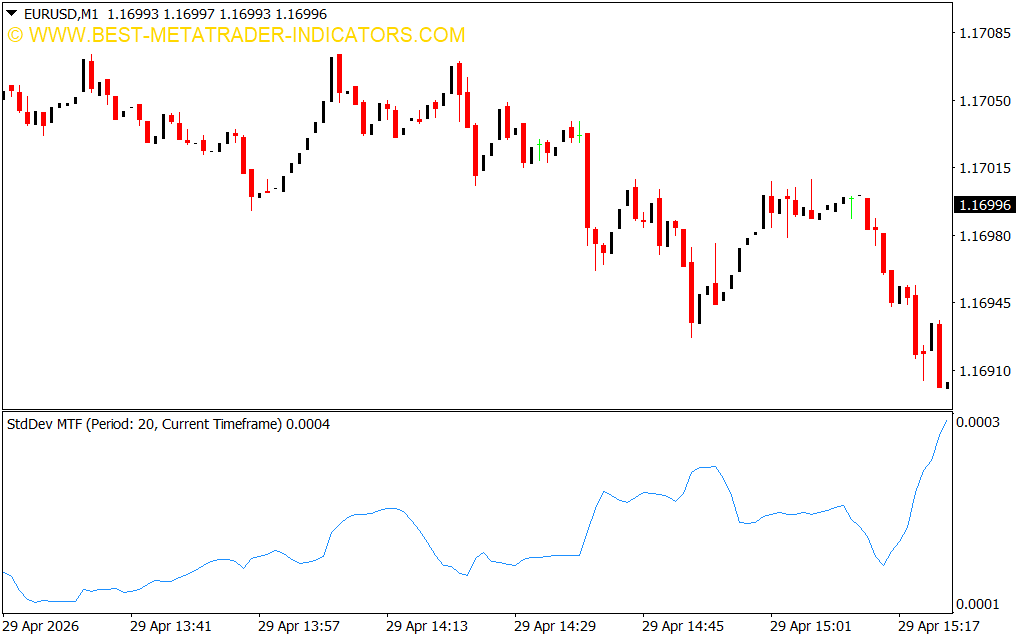
As shown on the EUR/USD M1 chart, the indicator is plotted in a sub-window as a single, oscillating line. Unlike other indicators that tell you "where" the market is going, the Standard Deviation tells you "how fast" and "how far" the market is stretching from its baseline.
Identifying the Volatility Cycle
The market moves in a constant cycle of low volatility (accumulation) and high volatility (distribution). The Standard Deviation indicator is the premier tool for identifying these phases:
- Low Standard Deviation: When the indicator line is near its historical lows, it suggests the market is in a "dead zone" or consolidation. Professional traders know that extended periods of low Standard Deviation are almost always followed by explosive breakouts.
- High Standard Deviation: A vertical surge in the indicator represents extreme market activity. This often occurs during news events or strong trend accelerations. However, when the line hits an extreme peak, it signals that the move may be overextended and a mean-reversion (return to the average) is likely.
Strategic Trading Applications
The Standard Deviation indicator is a versatile filter that can be applied to many trading styles:
- Breakout Anticipation: Look for the indicator to "flatline" at the bottom of its window. This is the "calm before the storm." Traders can set buy/sell stop orders above and below the current range to catch the inevitable volatility spike.
- Trend Confirmation: In a healthy trend, the Standard Deviation should rise alongside price. If price continues to make new highs but the Standard Deviation starts to fall, it indicates that the move is losing its "oomph" and a retracement is coming.
- Risk Management: Use volatility to set your stop-loss. During periods of high Standard Deviation, you may need a wider stop to avoid being taken out by "market noise." Conversely, in low-volatility environments, stops can be much tighter.
Conclusion
The Standard Deviation indicator is an essential asset for any trader who values mathematical precision over guesswork. By identifying the transition between market quiet and market chaos, it allows you to time your entries when the potential for a large move is highest. Whether you are using it to filter out flat markets or to identify trend exhaustion, the Standard Deviation provides the structural data needed to trade with professional confidence on the MT4 platform.
Last Update:
Apr 29, 2026 20:00 PM
Published:
Jan 30, 2026 20:04 PM
Category: