Predictive Precision: Mastering the Markets with Sliding Channels
In technical analysis, the ability to define the "boundaries" of price movement is the difference between a calculated entry and a speculative gamble. While static trendlines are useful, they often fail to account for the dynamic, shifting nature of market volatility. The Sliding Channels Indicator for MetaTrader is a sophisticated tool designed to solve this by creating automated, adaptive price corridors that evolve alongside market action.
What is the Sliding Channels Indicator?
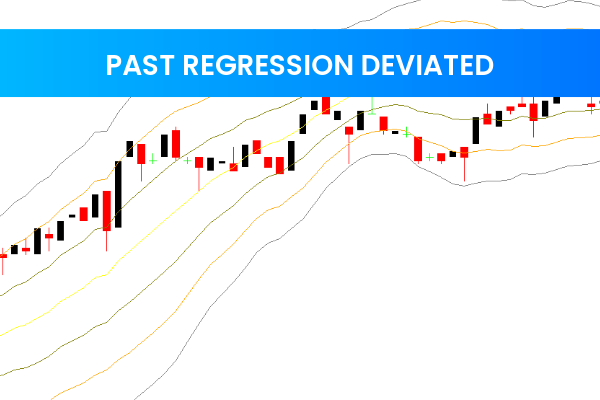
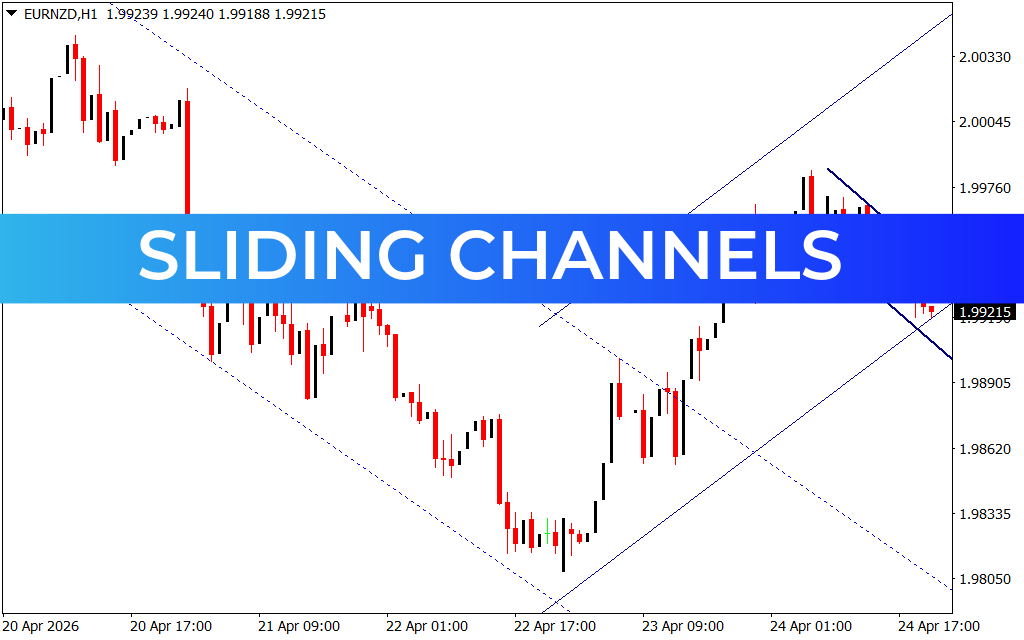
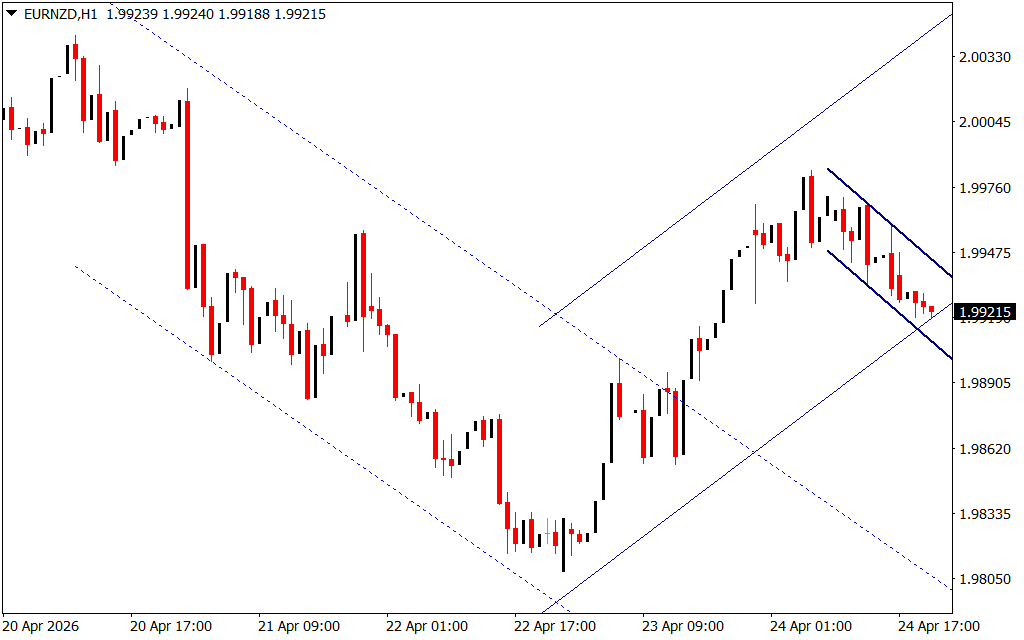
The Sliding Channels indicator is an advanced charting tool that identifies and projects price channels based on recent highs and lows. Unlike standard linear regression channels, "sliding" channels are built to be flexible. As seen in the EURNZD H1 chart, the indicator plots diagonal boundaries—often represented by solid or dashed lines—that encapsulate Price Action within a specific trend.
When price moves within these lines, it respects a mathematical equilibrium. When it breaks out, it signals a potential Trend Reversal or an acceleration of momentum.
Key Visual Components
By examining the H1 timeframe, we can see how the indicator organizes market chaos into three distinct phases:
- Descending Channels: Indicated by downward-sloping dashed lines, these highlight bearish phases where sellers are in control. Traders look for "rejection" at the upper boundary to enter short positions.
- Ascending Channels: Represented by upward-sloping solid lines, these mark bullish momentum. As price bounces off the lower support line of an ascending channel, it provides a high-probability "buy the dip" opportunity.
- Corrective Sliding: The indicator is unique in how it identifies secondary "inner" channels (seen in the recent price action). These smaller corridors help traders identify flags and pennants within a larger trend, offering precise exit points.
Strategic Application for Traders
The Sliding Channels tool is favored by swing traders and trend followers because it provides two essential data points: Slope and Range.
- Slope Analysis: The steepness of the channel indicates the strength of the trend. A shallow sliding channel suggests a weary trend ripe for reversal, while a steep channel confirms aggressive market participation.
- Boundary Trading: The outer edges of the channel act as dynamic Support And Resistance. Because these lines are "sliding" rather than fixed, they account for the most recent candle data, reducing the "lag" common in traditional indicators.
- Breakout Identification: A decisive candle close outside the sliding boundary is a primary signal for many breakout strategies. It suggests that the previous market cycle has ended and a new one is beginning.
Conclusion
The Sliding Channels indicator is a must-have for traders who prioritize structure over noise. By automating the drawing of trend corridors, it removes human subjectivity and provides a clear, mathematical framework for every trade. Whether you are navigating the volatile EURNZD or trading blue-chip stocks, these channels offer the structural clarity required to trade with confidence.
7 Downloads
Last Update:
Apr 25, 2026 16:29 PM
Published:
Feb 02, 2026 18:21 PM
Category: