Master Volatility with the SDX TZ Breakout Indicator
In the world of intraday Forex trading, the "opening range" or "session breakout" is one of the most profitable phenomena to exploit. Markets often consolidate during quiet sessions—like the Asian session—building up massive tension that eventually explodes during the London or New York open. The SDX TZ Breakout indicator is a professional-grade technical tool designed to capture these explosive moves by automatically mapping high-probability breakout zones directly on your MetaTrader charts.
What is the SDX TZ Breakout Indicator?
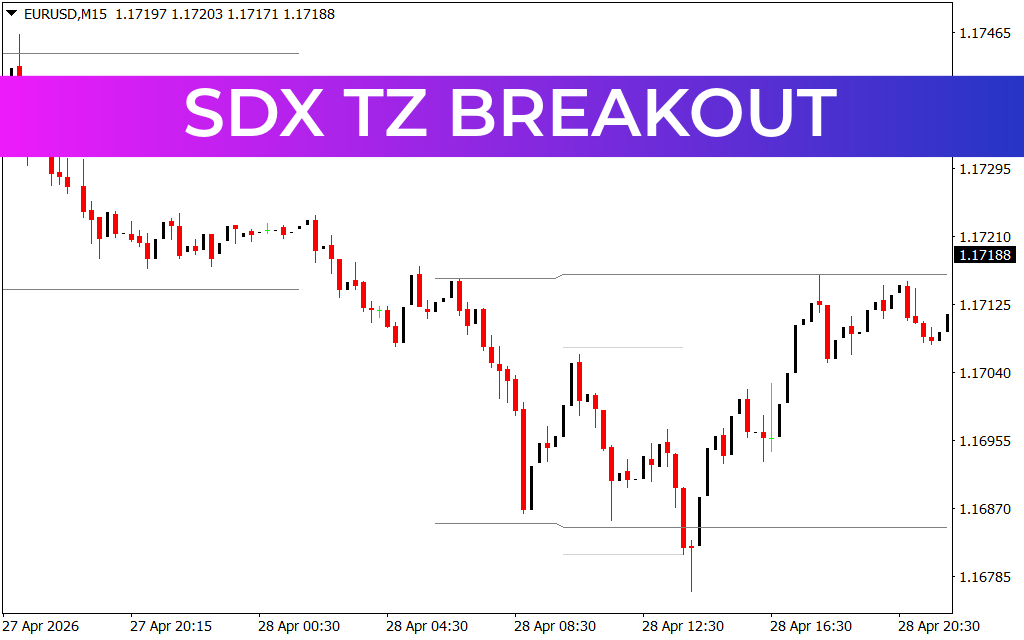
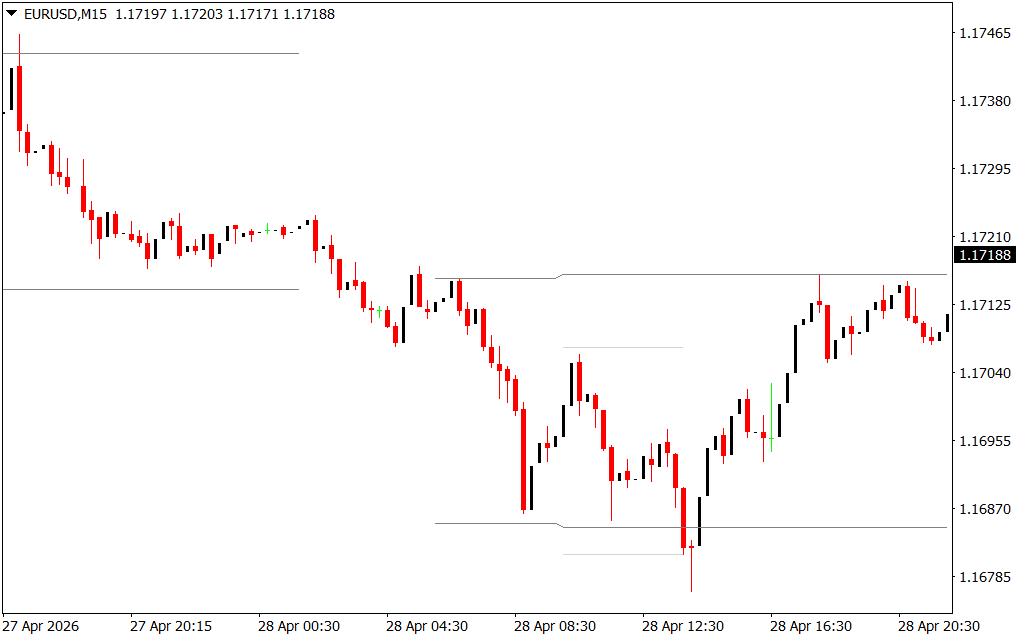
As showcased in the provided EUR/USD M15 chart, the SDX TZ Breakout indicator focuses on "Time Zone" (TZ) analysis. It identifies a specific window of time where the market is range-bound and draws a visual box around the Price Action. This box represents the structural "ceiling" and "floor" of the current session.
The indicator uses a clean, intuitive visual system:
- The Breakout Box: A shaded area representing the high and low of a specific time period.
- Support And Resistance Extensions: Once the range is established, the indicator projects horizontal levels into the future, acting as a roadmap for the coming session's volatility.
The Power of the "Box" Strategy
Breakout trading is a favorite among institutional traders because it relies on the momentum of "trapped" orders. When the price breaks out of the SDX TZ box, it signals that the period of indecision has ended and a new directional trend has begun.
- Objective Entry Points: Instead of guessing where the trend might start, the SDX TZ Breakout gives you a precise price level. If the price closes above the box, it's a "Buy" signal; if it closes below, it's a "Sell" signal.
- Eliminating Overtrading: By focusing on specific time zones, the indicator encourages traders to wait for high-impact periods. This prevents you from getting chopped up in the low-liquidity sideways markets that occur between major sessions.
- Visual Risk Management: The dimensions of the box provide a natural framework for stop-loss placement. A common strategy is to place a stop-loss at the opposite side of the breakout box, ensuring a mathematically sound risk-to-reward ratio.
Strategic Implementation: Timing the Move
In the provided EUR/USD example, the indicator tracks the evolution of Market Structure on the 15-minute timeframe. Notice how the indicator highlights zones where the price was consolidating before a significant expansion. By using the SDX TZ Breakout, you can ignore the minor "flickers" of price action and focus on the levels that actually trigger institutional flow.
For the best results, traders should look for "Break and Retest" setups. Often, the price will break out of the box, return to touch the boundary (validating it as new support or resistance), and then continue in the breakout direction. This provides an even higher-probability entry with lower risk.
Conclusion
The SDX TZ Breakout Indicator is an essential asset for any day trader looking to capitalize on session volatility. By automating the identification of breakout ranges, it allows you to trade with clarity and discipline. Stop chasing every minor move and start trading the definitive breaks with the precision of SDX TZ logic.
1 Download
Last Update:
May 03, 2026 01:43 AM
Published:
Jan 28, 2026 18:24 PM
Category: