Unlock Market Insights with the SB Volume Average Indicator for MT4
In the world of technical analysis, price is often considered the "what," but volume is undeniably the "why." While Price Action tells you where the market has moved, volume reveals the conviction behind that move. However, raw volume data can be erratic and difficult to interpret at a glance. The SB Volume Average Indicator for MetaTrader 4 is a professional-grade tool designed to smooth out this data, providing a clear visual representation of market participation and institutional activity.
What is the SB Volume Average Indicator?
The SB Volume Average Indicator is a sophisticated volume oscillator that combines raw tick volume with a customized smoothing average. Instead of simply looking at vertical bars, this indicator calculates the relationship between current volume and its historical average to identify periods of high-conviction accumulation or distribution.
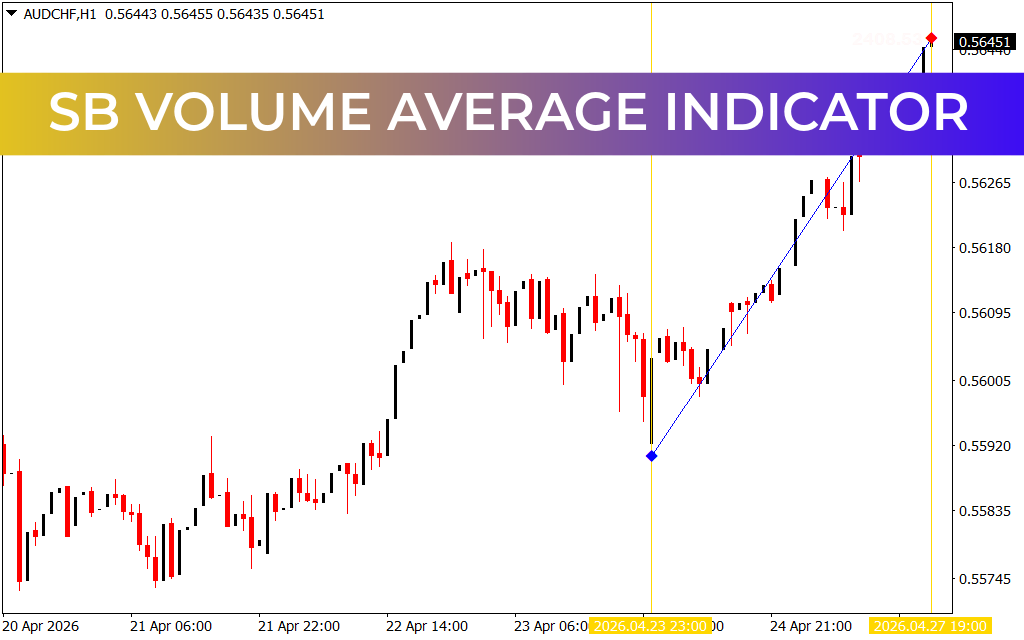
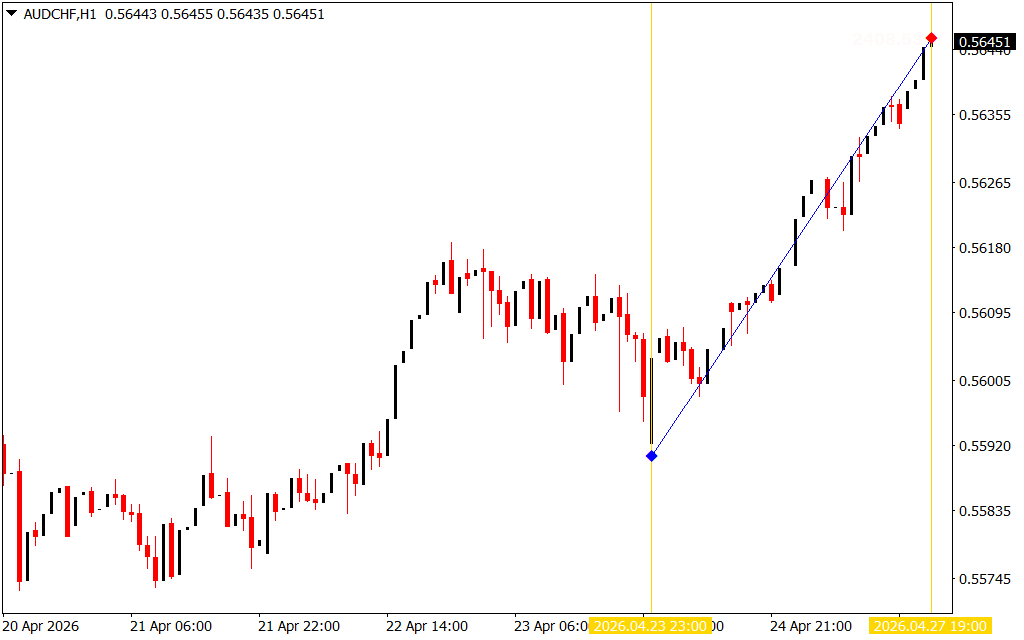
As seen in the provided AUD/CHF H1 chart, the indicator appears in a sub-window as a dynamic histogram.
- Rising Bars: Indicate increasing market interest and the injection of fresh liquidity.
- Falling Bars: Suggest a lack of conviction or "retail" participation, often signaling that a move is likely to stall or reverse.
- The Average Line: Acts as the benchmark for "normal" market activity. When volume bars surge above this average, it highlights the presence of "Smart Money."
Why Volume Averaging is Essential
The primary challenge with standard volume indicators is that they don't distinguish between a minor price fluctuation and a major structural shift. The SB Volume Average solves this by:
- Identifying Genuine Breakouts: A price breakout without a corresponding spike in the volume average is often a "fakeout." By requiring the SB Volume Average to confirm the move, you significantly increase your trade accuracy.
- Spotting Trend Exhaustion: If the price is making new highs but the SB Volume Average is trending downward, it indicates a "divergence." This suggests that the big players are no longer supporting the move, and a reversal is imminent.
- Filtering Market Noise: On lower timeframes, volume can be "spiky." This indicator smooths that noise, allowing you to focus on sustained periods of institutional pressure.
Strategic Application: The Volume Confirmation
The most effective way to trade with the SB Volume Average is to use it as a Momentum Filter.
- The Long Setup: Look for a bullish candlestick pattern at a key support level. Confirm the entry only if the SB Volume histogram is rising and crossing above its internal average. This proves that buyers are aggressively defending the level.
- The Short Setup: During a breakdown of support, wait for a volume surge. This confirms that the selling pressure is broad-based and likely to continue to lower targets.
On the AUD/CHF chart, notice how the volume expansion aligns with the strongest parts of the price moves. This allows the trader to enter with confidence and exit when the volume "dries up," protecting profits before the market enters a sideways phase.
Conclusion
The SB Volume Average Indicator is an indispensable asset for any MT4 trader who wants to see beneath the surface of price action. By quantifying market conviction through an smoothed averaging algorithm, it provides the structural clarity needed to follow the big players and avoid the traps of a low-liquidity market.
15 Downloads
Last Update:
Apr 27, 2026 22:22 PM
Published:
Feb 01, 2026 12:20 PM
Category: