Master Trend Reversals with the SAR Oscillator Indicator for MT4
In the high-stakes environment of Forex trading, timing is the ultimate differentiator between a winning trade and a missed opportunity. While the classic Parabolic SAR (Stop and Reverse) is a legendary tool for identifying trend direction, its overlay on price charts can sometimes lead to visual clutter. The SAR Oscillator Indicator for MetaTrader 4 (MT4) takes this proven mathematical logic and moves it into a dedicated oscillator window, providing traders with a clean, histogram-based view of market acceleration and momentum shifts.
The Science of Trend Exhaustion and Reversal
The SAR Oscillator is engineered to solve a specific problem: identifying the exact moment a trend loses its structural integrity. It calculates the relationship between price and the parabolic acceleration factor, but presents the data as a histogram that oscillates around a central zero line. This transformation allows for a much more nuanced analysis of Trend Strength.
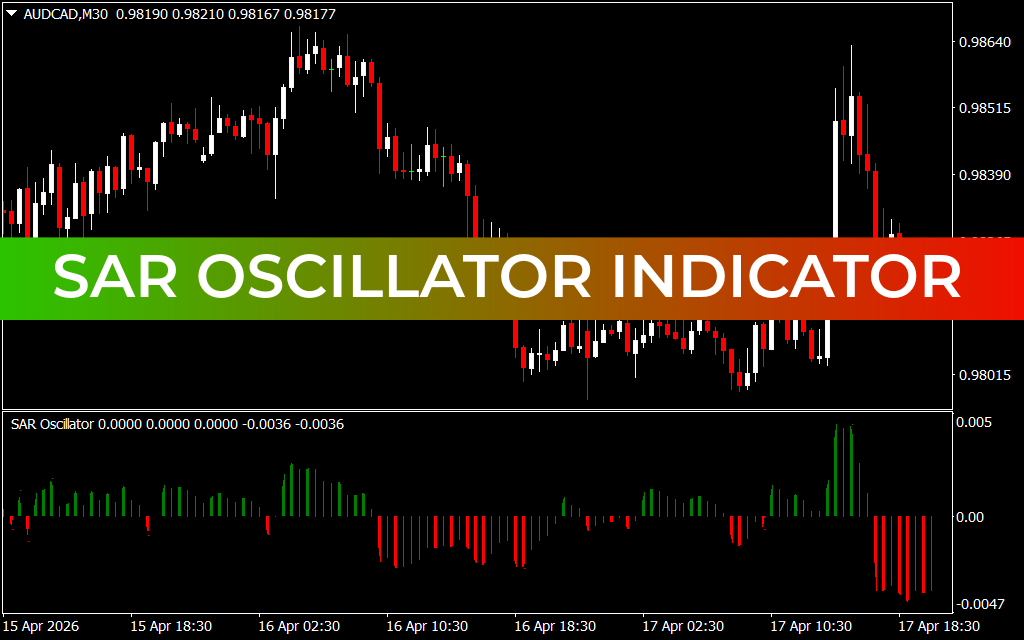
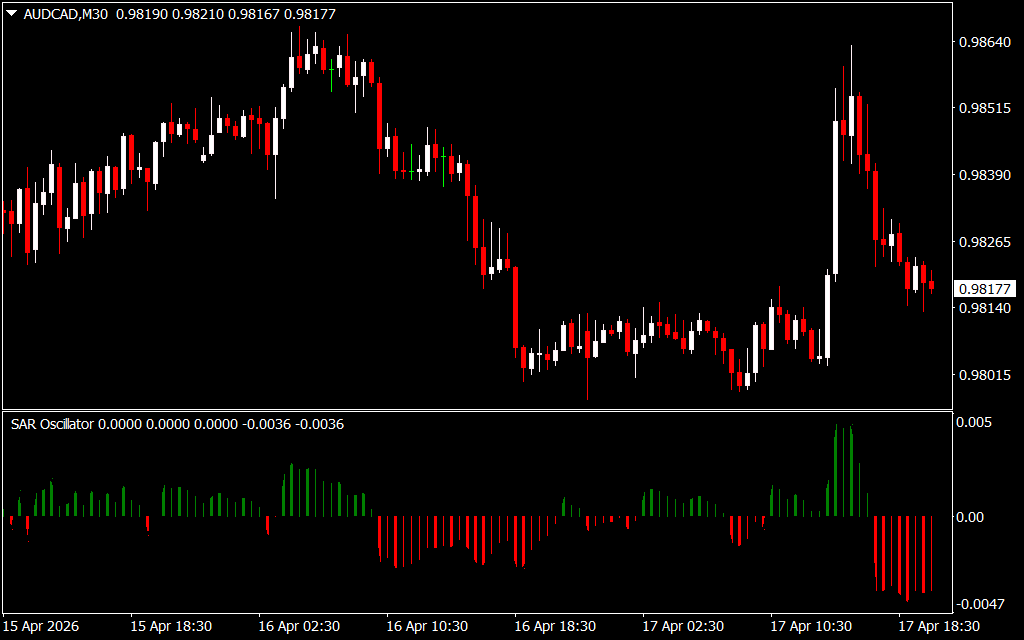
As observed in technical analysis on high-liquidity pairs like AUD/CAD on the M30 timeframe, the SAR Oscillator provides a definitive operational edge:
- Histogram-Driven Sentiment: The indicator utilizes color-coded bars—typically Green for bullish momentum and Red for bearish momentum. As seen on recent M30 charts, when the bars flip from one side of the zero line to the other, it signals a mechanical Trend Reversal, allowing traders to enter new positions at the very beginning of a cycle.
- Visualizing Acceleration: Unlike a static line, the height of the SAR Oscillator bars represents the acceleration of the trend. Growing bars indicate an accelerating move, while shrinking bars warn of a potential "rounding top" or "bottom," signaling that it may be time to tighten stop-losses or take profits.
- Institutional Structural Clarity: By moving the SAR logic to a sub-window, price action on the main chart remains unobstructed. This allows traders to combine structural analysis—like identifying Support And Resistance zones—with the objective momentum data provided by the oscillator.
- Surgical Entry and Exit Points: The "Zero-Cross" is the primary signal for systematic traders. A shift from a deep red histogram to the first green bar often marks the end of a distribution phase and the start of a fresh accumulation wave.
Strategic Implementation for Professional Traders
The SAR Oscillator Indicator is an essential asset for any trader who values a disciplined, data-driven approach.
- Trend Following with Precision: Use the oscillator to stay aligned with the dominant flow. If the histogram is consistently green, only look for long setups on the price chart. This simple filter significantly increases the win rate of any base strategy.
- Trailing Stop Optimization: Use the peaks of the oscillator to adjust your risk. When the histogram bars begin to shorten despite price making new highs (divergence), it is a clear signal that the trend is overextended.
- Cross-Timeframe Verification: For maximum accuracy, align the SAR Oscillator across timeframes. A green histogram on both the H1 and M30 provides a high-conviction signal for intraday Trend Continuation.
Conclusion
The SAR Oscillator Indicator for MT4 is a definitive solution for traders who demand clarity and mathematical precision. By bridging the gap between classic parabolic logic and modern histogram visualization, it empowers you to navigate the financial markets with professional-grade confidence. Elevate your technical analysis today and master the art of the reversal with the SAR Oscillator system.
2 Downloads
Last Update:
Apr 17, 2026 23:43 PM
Published:
Feb 08, 2026 10:37 AM
Category: