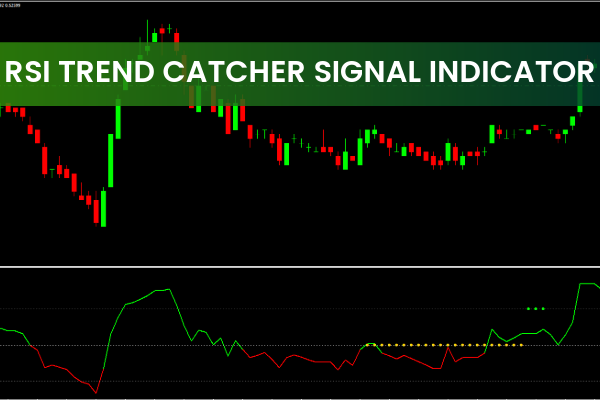
The RSI Trend Catcher Signal Indicator for MT4 is a powerful improvement to the traditional Relative Strength Index. Designed for simplicity and precision, it helps traders quickly identify overbought and oversold zones, spot bullish and bearish divergences, and visualize trend direction using color-coded signals. Because it works similarly to the classic RSI but offers enhanced clarity, traders of all levels can use it to refine their technical strategies.
What Makes the RSI Trend Catcher Signal Unique?
Unlike the standard RSI, which displays a single oscillating line, the RSI Trend Catcher uses three distinct colors—red, green, and yellow—each representing a specific market condition:
Red Line: bearish trend / selling pressure
Green Line: bullish trend / buying pressure
Yellow Line: ranging or neutral market
These visual enhancements make trend interpretation easier, especially during fast-moving market conditions.
Overbought and Oversold Levels for Trade Timing
Just like the classic RSI 14-period setup, this indicator still respects the well-known thresholds:
Below 30 = Oversold → potential BUY
Above 70 = Overbought → potential SELL
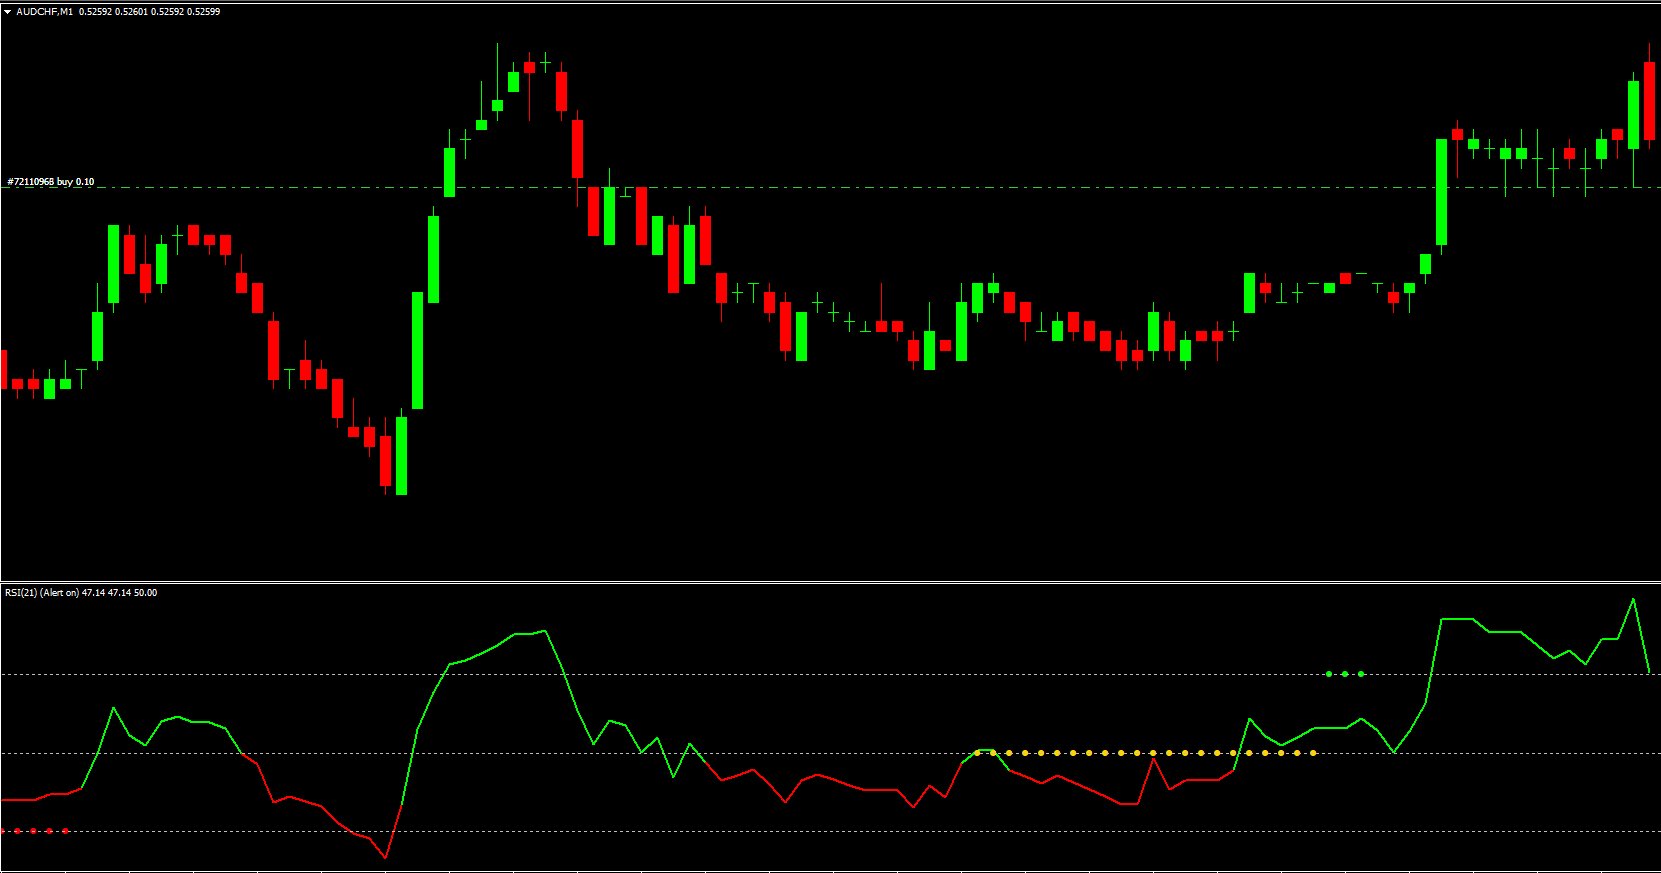
However, the RSI Trend Catcher Signal presents these conditions in a more actionable format. When the RSI drops below 30 and the indicator paints red, it signals bearish strength and potential short entries. Conversely, when RSI rises above 70 and the indicator turns green, buying opportunities may begin forming.
Another advantage is its ability to detect divergences, allowing you to anticipate reversals earlier than with the standard RSI.
How to Trade With the RSI Trend Catcher Signal Indicator
The indicator also displays the current trend state on the top-left corner of the chart—making it even easier to understand market momentum at a glance.
BUY Strategy
The indicator must show a green line.
Wait for the green line to fully form to avoid premature entries.
Enter a BUY when the color changes from red to green.
Set a stop-loss just below the recent swing low.
Exit when the RSI line changes color again.
SELL Strategy
The indicator must display a red line.
Wait for the red ribbon to fully develop.
Enter a SELL when the indicator transitions from green to red.
Place a stop-loss above the recent swing high.
Exit when the RSI line changes color.
Multi-Scenario Trading Benefits
The indicator can be used for:
Reversal detection
Divergence trading
Range identification
Because of its versatility, it works on all timeframes, from M1 scalping to long-term position trading. Traders can also combine it with Price Action, moving averages, or support/resistance levels to increase accuracy and filter out weak signals.
Final Thoughts
The RSI Trend Catcher Signal Indicator for MT4 is one of the easiest and most visually intuitive tools for identifying trends, continuations, and reversals. Its enhanced color-coded system helps traders make clearer decisions while still maintaining the core principles of RSI. It works on all timeframes and is ideal for traders seeking clean, actionable signals. For more MT4 indicators and trading tools, visit IndicatorForest.com.
FAQ
2 Downloads
Published:
Nov 28, 2025 23:46 PM
Category: