Precision Trading Unleashed: The RBCI Hist Indicator Guide
In the competitive landscape of financial trading, identifying the cycle of the market is often more important than identifying the price itself. The RBCI Hist Indicator (Range Bound Channel Index Histogram) is a premier technical tool designed for traders who demand precision in identifying market turning points and cyclical trends. By filtering out market "noise" and focusing on the underlying frequency of Price Action, this indicator provides a cleaner, more actionable perspective on any asset class.
What is the RBCI Hist Indicator?
The RBCI is a digital filter-based indicator that belongs to the family of "spectral analysis" tools. Unlike standard oscillators that can get pinned at overbought or oversold levels during strong trends, the RBCI Hist focuses on the difference between a broad-band filter and a low-pass filter.
In simpler terms, it removes both the very short-term price fluctuations (the noise) and the very long-term trend components. The result is a histogram that oscillates around a zero line, clearly highlighting the mid-term cycles that are most profitable for day traders and swing traders alike.
Why Professional Traders Choose RBCI Hist
The power of the RBCI Hist lies in its ability to predict exhaustion. When the histogram bars reach extreme peaks or troughs and begin to retract toward the zero line, it often precedes a significant price reversal or a period of consolidation.
- Zero-Line Crossovers: A move from negative to positive territory signals the beginning of a bullish cycle, while a drop below zero indicates bearish dominance.
- Divergence Detection: One of the most potent uses of the RBCI Hist is identifying divergences. If price makes a new high but the RBCI Hist makes a lower high, a Trend Reversal is likely imminent.
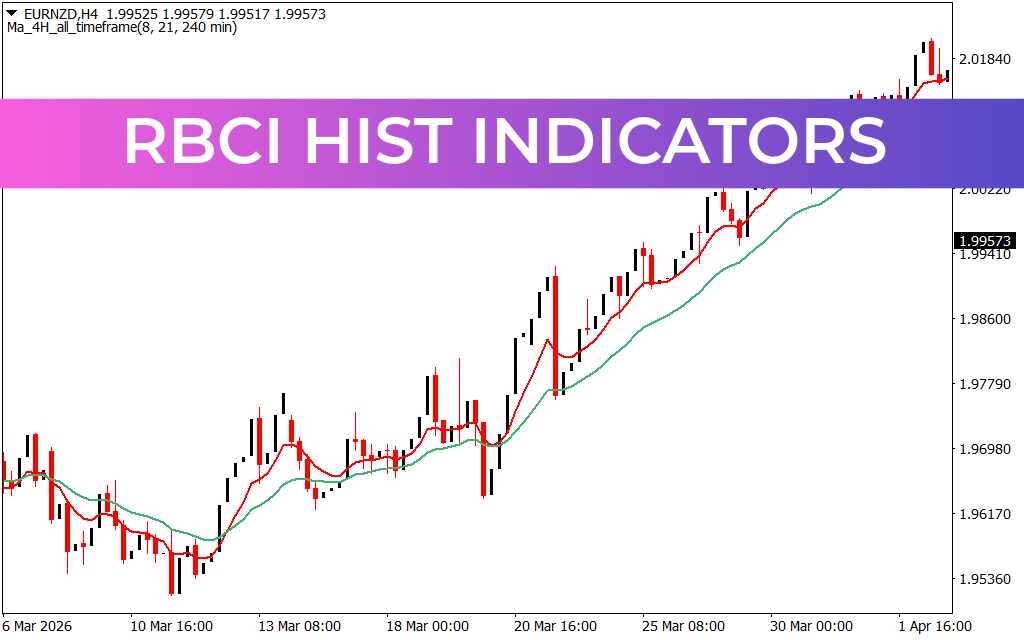
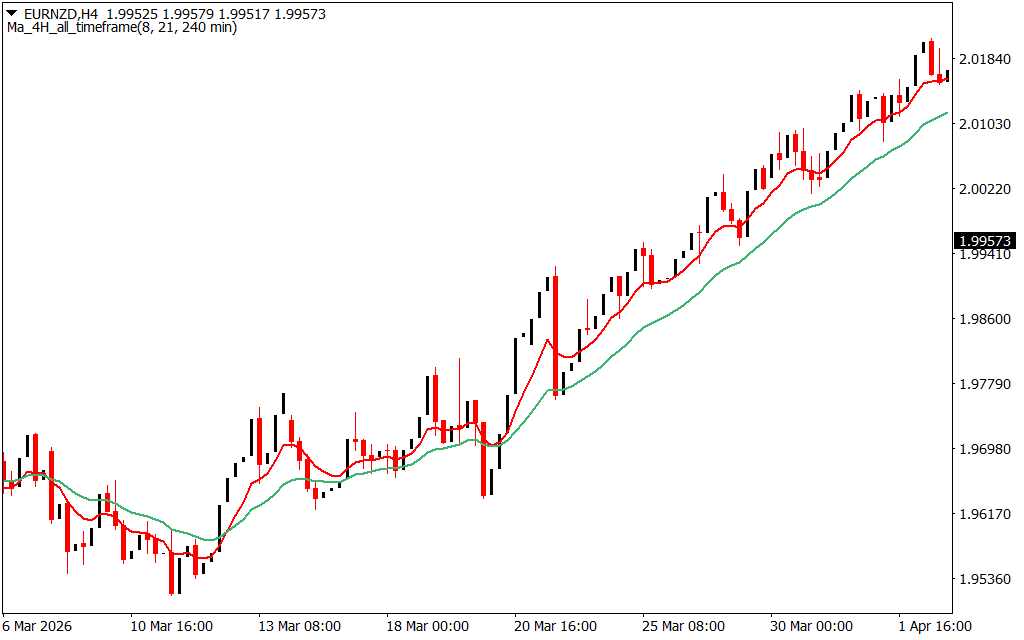
- Multi-Timeframe Synergy: As demonstrated in the H4 chart of EURNZD, using digital filters alongside moving averages helps traders stay on the right side of the "big money" moves while avoiding the traps of minor retracements.
Optimizing Your Strategy
To maximize the effectiveness of the RBCI Hist, it should be used as a secondary confirmation tool. For instance, in a strong uptrend (where price stays above the green moving average as seen in the provided image), traders should look for the RBCI Hist to dip into negative territory and then hook back upward. This "buy the dip" approach ensures you are entering trades with the momentum of the market cycle at your back.
For sellers, the reverse applies: wait for the histogram to peak and roll over while price action hits resistance levels. This disciplined approach reduces "over-trading" and focuses your capital on high-probability setups.
4 Downloads
Last Update:
Apr 24, 2026 15:15 PM
Published:
Feb 03, 2026 12:38 PM
Category: