The Rate Of Change (ROC) Indicator for MetaTrader 5 (MT5) is a powerful momentum oscillator that measures the percentage change between the current closing price and the closing price from “n” previous periods. This indicator helps forex traders determine the speed and direction of price movement, making it an essential tool for identifying trend reversals, divergences, and overbought or oversold conditions.
By providing a clear view of momentum shifts, the Rate Of Change Indicator allows traders to anticipate potential market reversals or confirm existing trends. Its versatility makes it suitable for both beginners and experienced forex traders looking to refine their entry and exit strategies.
How the Rate Of Change Indicator Works
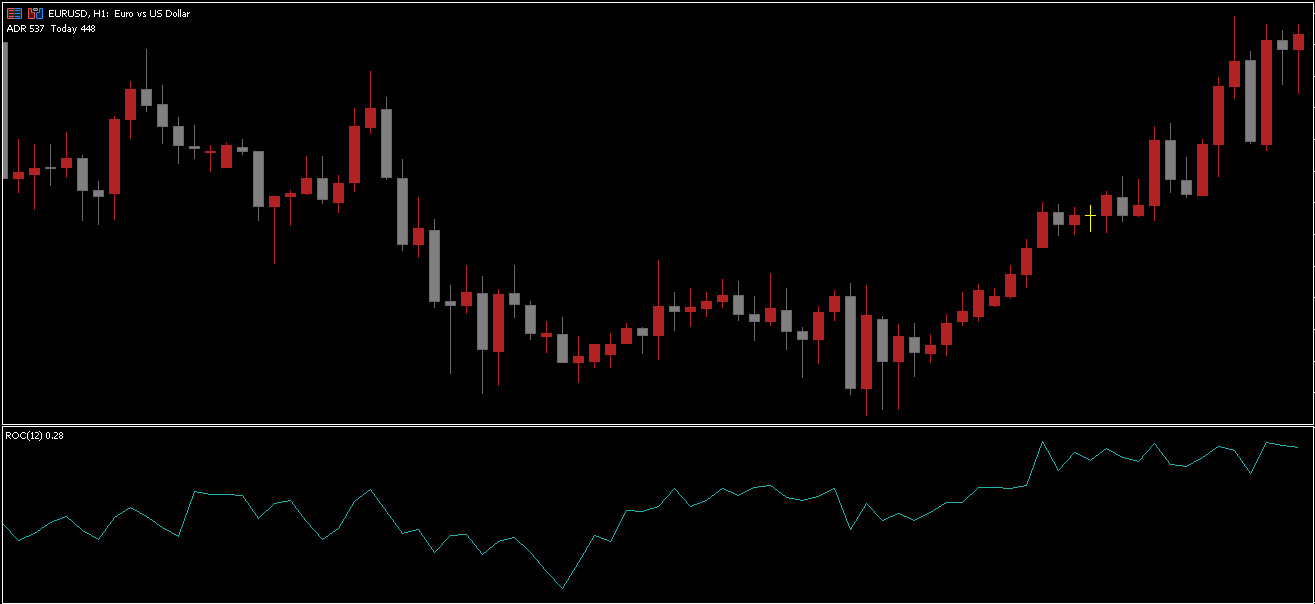
The ROC Indicator calculates the rate of price change as a percentage over a specific period. It then plots this data as an oscillator that fluctuates above and below a zero line in a separate indicator window.
Positive ROC values suggest increasing bullish momentum.
Negative ROC values indicate growing bearish pressure.
Unlike other oscillators (such as RSI or Stochastic), the ROC has no fixed upper or lower bounds, which allows for a more dynamic interpretation of extreme price movements.
How to Trade Using the Rate Of Change Indicator for MT5
The USD/JPY H4 chart above demonstrates how the ROC Indicator provides actionable signals. There are three main methods for using ROC in trading:
Zero Line Crossovers
The most common approach is to trade based on zero line crossovers:
When the ROC crosses above the zero line, it signals a BULLISH trend — consider entering a BUY trade.
Place the stop loss below the recent swing low.
Hold the position as long as the ROC remains above zero.
When the ROC falls below the zero line, it signals a BEARISH trend — consider a SELL trade.
Place the stop loss above the recent swing high.
A sharp rise above zero confirms strong bullish momentum, while a steep drop below zero indicates a strong bearish market.
Divergence and Convergence Signals
Divergences occur when price and the ROC indicator move in opposite directions, signaling potential reversals:
Bullish Divergence: Price makes a lower low while ROC forms a higher low → suggests upcoming bullish reversal.
Bearish Divergence: Price makes a higher high while ROC forms a lower high → indicates possible bearish reversal.
These signals are often early warnings of momentum fading, allowing traders to enter reversals or exit trades early.
Support and Resistance on the ROC Chart
Advanced traders can draw Support And Resistance levels or channels directly on the ROC window.
Breakouts or bounces from these levels can provide confirmation signals aligned with Price Action. This approach combines momentum analysis with technical structure for improved accuracy.
Tips for Using the ROC Indicator Effectively
Use the ROC in conjunction with other indicators such as Moving Averages, MACD, or RSI to confirm trends.
Be cautious of false signals during periods of low volatility.
Avoid overreacting to short-term ROC spikes — always consider the broader market context.
Adjust the “n” period setting based on your trading style (shorter for Scalping, longer for swing trading).
Conclusion
The Rate Of Change Indicator for MT5 is a versatile and efficient tool for measuring price momentum and identifying potential trend reversals. Whether you’re trading divergences, zero-line crossovers, or breakout strategies, the ROC provides valuable insights into market strength and speed.
However, like all momentum indicators, ROC signals can lag behind real-time price movements. Therefore, traders should use it in combination with other tools and price action strategies for optimal accuracy.
FAQ
2 Downloads
Published:
Nov 07, 2025 09:32 AM
Category: