Precision Trading with Pro4X Pivot Lines: Your Blueprint for Market Structure
In the fast-paced world of Forex and CFD trading, the ability to identify key price levels before they are reached is the difference between reacting to the market and anticipating it. The Pro4X Pivot Lines indicator is a high-performance technical tool designed to automatically calculate and plot the most significant Support And Resistance levels based on mathematical price averages. By providing a clear visual roadmap, it allows traders to identify "value areas" where big institutional players are likely to enter or exit the market.
The Power of Pivot Points
Pivot points are a staple of professional floor traders. Unlike lagging indicators like moving averages, pivots are leading indicators. They use the previous period's high, low, and close to project future levels where price is statistically likely to stall or reverse. The Pro4X Pivot Lines takes this classic concept and enhances it for the modern MetaTrader environment, offering unmatched clarity and precision.
How to Read the Pro4X Landscape
When you load Pro4X Pivot Lines onto your chart, you are presented with a series of horizontal levels that act as psychological boundaries for the market:
- The Central Pivot (PP): This is the "fair value" line. If the price is trading above the PP, the sentiment is generally bullish; below it, the bears are in control.
- Resistance Levels (R1, R2, R3): These are the "ceilings." In an uptrend, these are your primary take-profit targets or areas where you might look for bearish reversals.
- Support Levels (S1, S2, S3): These are the "floors." In a downtrend, these levels provide the highest probability for a bounce or a trend exhaustion exit.
Multi-Timeframe Strategy Integration
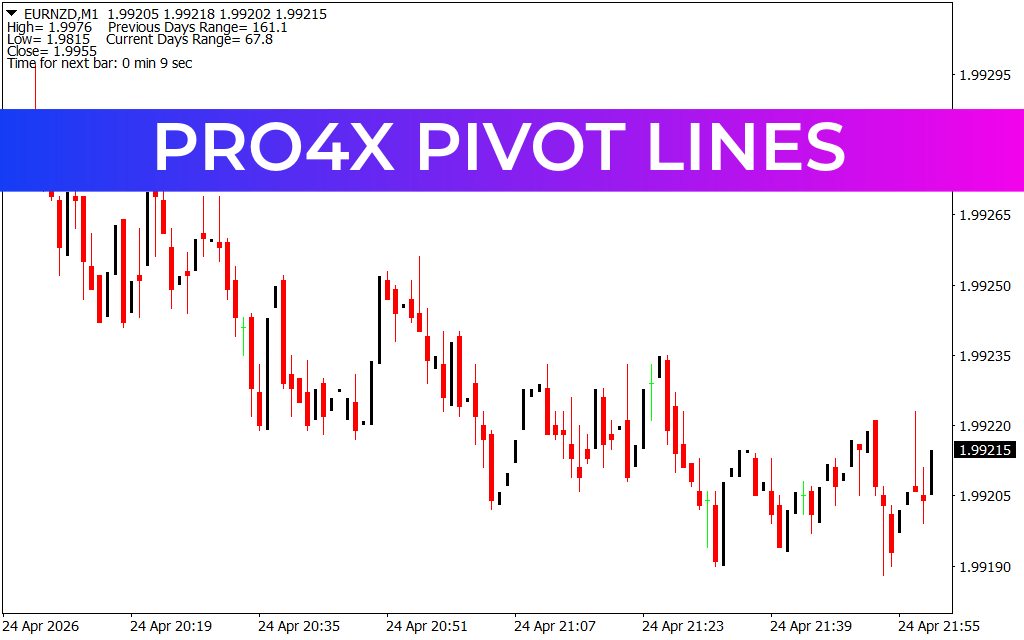
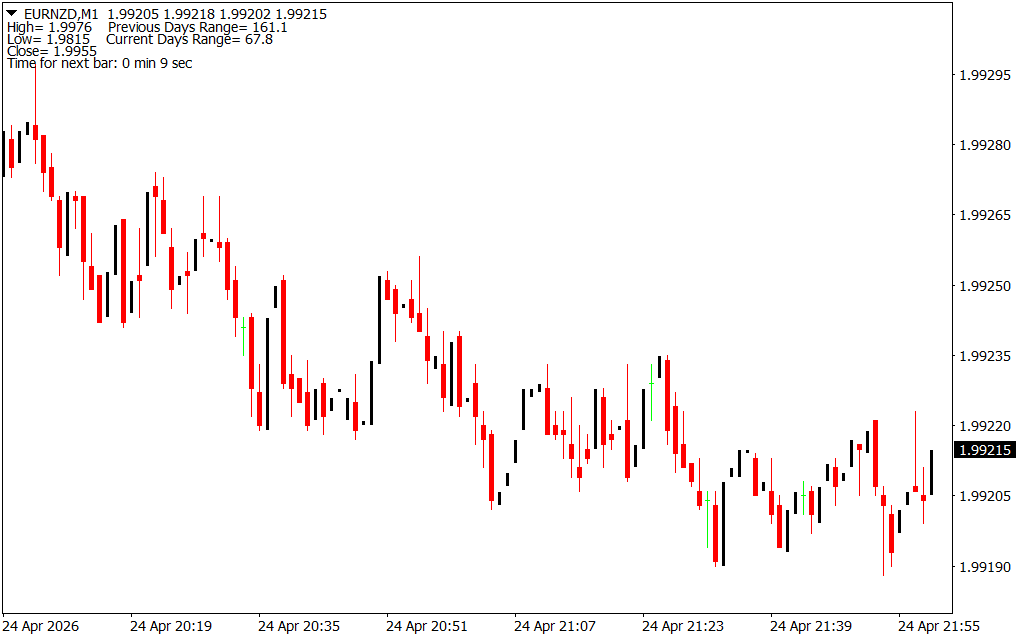
As demonstrated in the EURNZD Weekly and M1 charts, the Pro4X Pivot Lines is versatile enough for any trading style.
- For Scalpers: Using pivots on the 1-minute (M1) chart allows you to catch quick intraday bounces between S1 and R1.
- For Swing Traders: Applying pivots to the Weekly (W1) chart helps identify major structural shifts. When price breaks and closes above a Weekly Resistance level, it often signals a massive breakout that can last for hundreds of pips.
Why Choose Pro4X?
The "Pro" in Pro4X stands for accuracy and automation. Standard pivot indicators often clutter the screen or fail to adjust to different broker timezones. Pro4X is engineered to stay clean, providing labels and price quotes for every line. This eliminates manual calculation errors and ensures that your stop-loss and take-profit orders are placed at mathematically sound levels.
By integrating Pro4X Pivot Lines into your trading system, you stop chasing price and start waiting for it. Whether you are trading breakouts or mean-reversion strategies, these lines provide the objective data needed to manage risk and maximize reward.
1 Download
Last Update:
Apr 26, 2026 22:48 PM
Published:
Feb 02, 2026 02:09 AM
Category: